R: Univariate correlation test for multiple variables
multtest.cor
R Documentation
Univariate correlation test for multiple variables
Description
Performs correlation tests between one variable and a series of other variables, and corrects p-values.
Usage
multtest.cor(mult.var, uni.var, method = "pearson", p.method = "fdr",
  ordered = TRUE)

## S3 method for class 'multtest.cor'
plot(x, arrows = TRUE, main = NULL, pch = 16,
  cex = 1, col = c("red", "orange", "black"), labels = NULL, ...)
Arguments
mult.var
data frame containing a series of numeric variables.
uni.var
numeric variable (vector).
method
a character string indicating which correlation coefficient is to be computed. See help of cor.
p.method
method for p-values correction. See help of p.adjust.
ordered
logical indicating if variables should be ordered based on correlation values.
x
object returned from multtest.cor.
arrows
logical indicating if arrows should be plotted. If FALSE, points are displayed at the extremity of the arrows.
main
optional title of the graph.
pch
symbol(s) used for points, when points are displayed (see arrows).
cex
size of points and labels (see help of dotchart).
col
vector of three colors: first for variables with P < 0.05, second for variables with 0.05 < P < 0.1, third for variables with P > 0.1. Recycled if only one value.
labels
names of the variables. If NULL (default), labels correspond to names found in mult.var.
...
not used.
Author(s)
Maxime Herv<c3><a9> <mx.herve@gmail.com>
See Also
cor.test
Examples
data(iris)
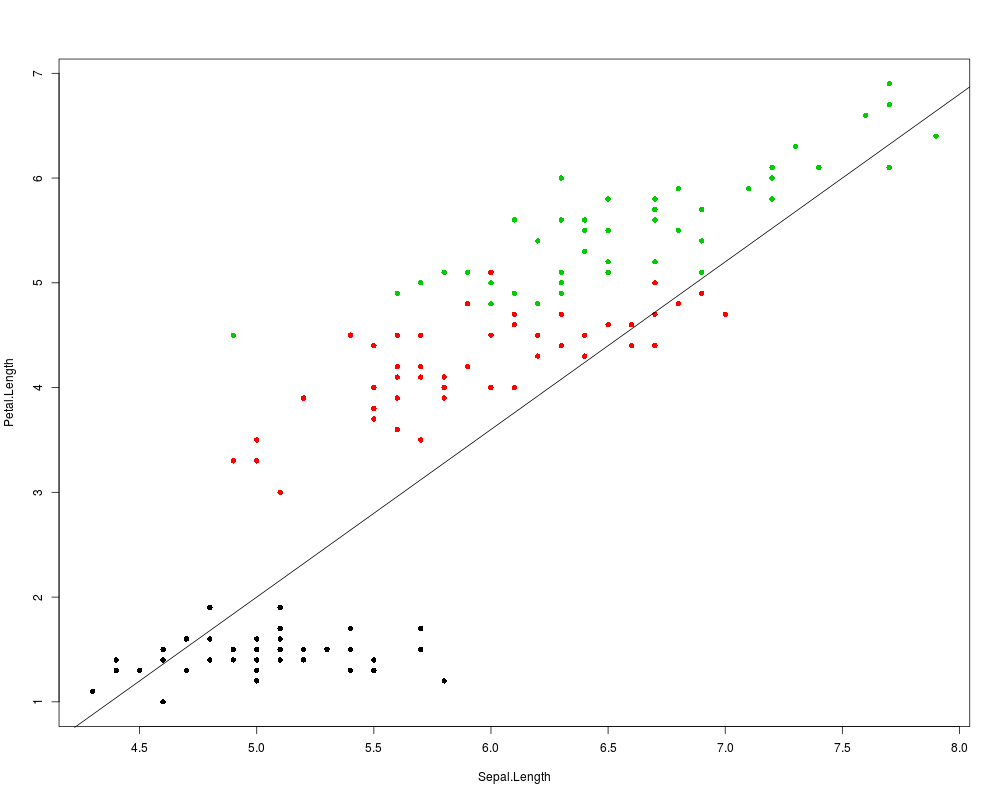
# Original coordinates
plot(Petal.Length~Sepal.Length,pch=16,col=as.numeric(iris$Species),data=iris)
# New axis
abline(-6,1.6)
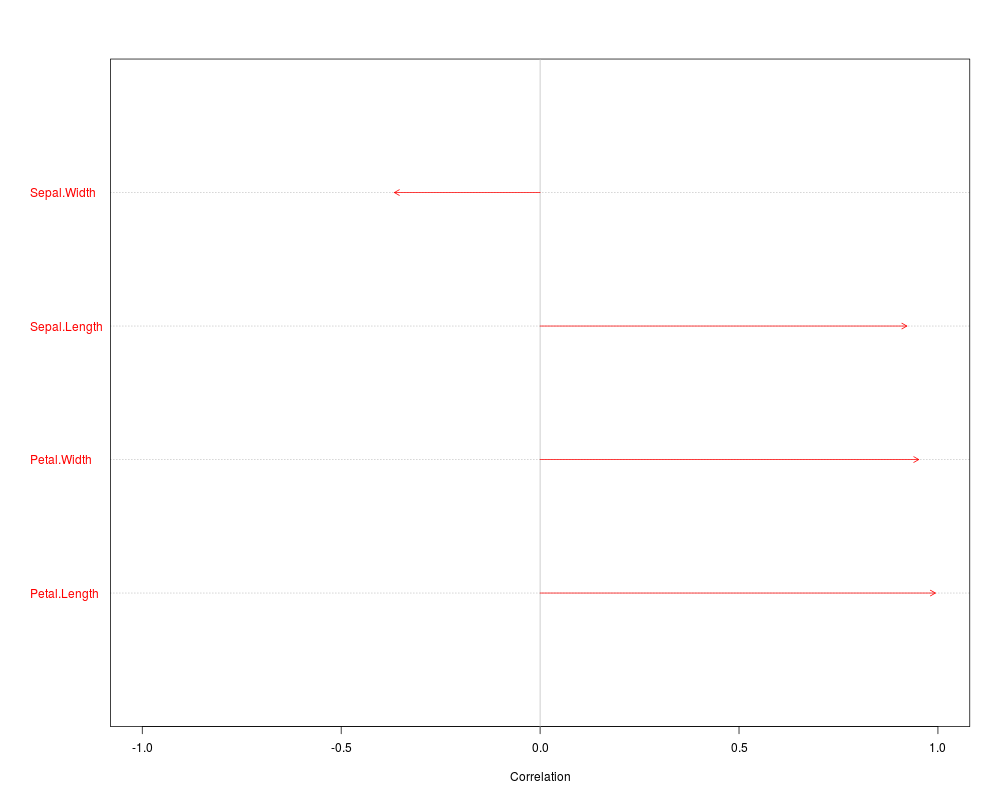
# Coordinates on new axis
new.coord <- coord.proj(iris[,c("Sepal.Length","Petal.Length")],1.6)
# Correlation between the whole dataset and new coordinates
mult.cor <- multtest.cor(iris[,1:4],new.coord)
plot(mult.cor)
Results
R version 3.3.1 (2016-06-21) -- "Bug in Your Hair"
Copyright (C) 2016 The R Foundation for Statistical Computing
Platform: x86_64-pc-linux-gnu (64-bit)

R is free software and comes with ABSOLUTELY NO WARRANTY.
You are welcome to redistribute it under certain conditions.
Type 'license()' or 'licence()' for distribution details.

R is a collaborative project with many contributors.
Type 'contributors()' for more information and
'citation()' on how to cite R or R packages in publications.

Type 'demo()' for some demos, 'help()' for on-line help, or
'help.start()' for an HTML browser interface to help.
Type 'q()' to quit R.

> library(RVAideMemoire)
*** Package RVAideMemoire v 0.9-56 ***
> png(filename="/home/ddbj/snapshot/RGM3/R_CC/result/RVAideMemoire/multtest.cor.Rd_%03d_medium.png", width=480, height=480)
> ### Name: multtest.cor
> ### Title: Univariate correlation test for multiple variables
> ### Aliases: multtest.cor plot.multtest.cor
>
> ### ** Examples
>
> data(iris)
>
> # Original coordinates
> plot(Petal.Length~Sepal.Length,pch=16,col=as.numeric(iris$Species),data=iris)
>
> # New axis
> abline(-6,1.6)
>
> # Coordinates on new axis
> new.coord <- coord.proj(iris[,c("Sepal.Length","Petal.Length")],1.6)
>
> # Correlation between the whole dataset and new coordinates
> mult.cor <- multtest.cor(iris[,1:4],new.coord)
> plot(mult.cor)
>
>
>
>
>
> dev.off()
null device
          1
>
 .
.