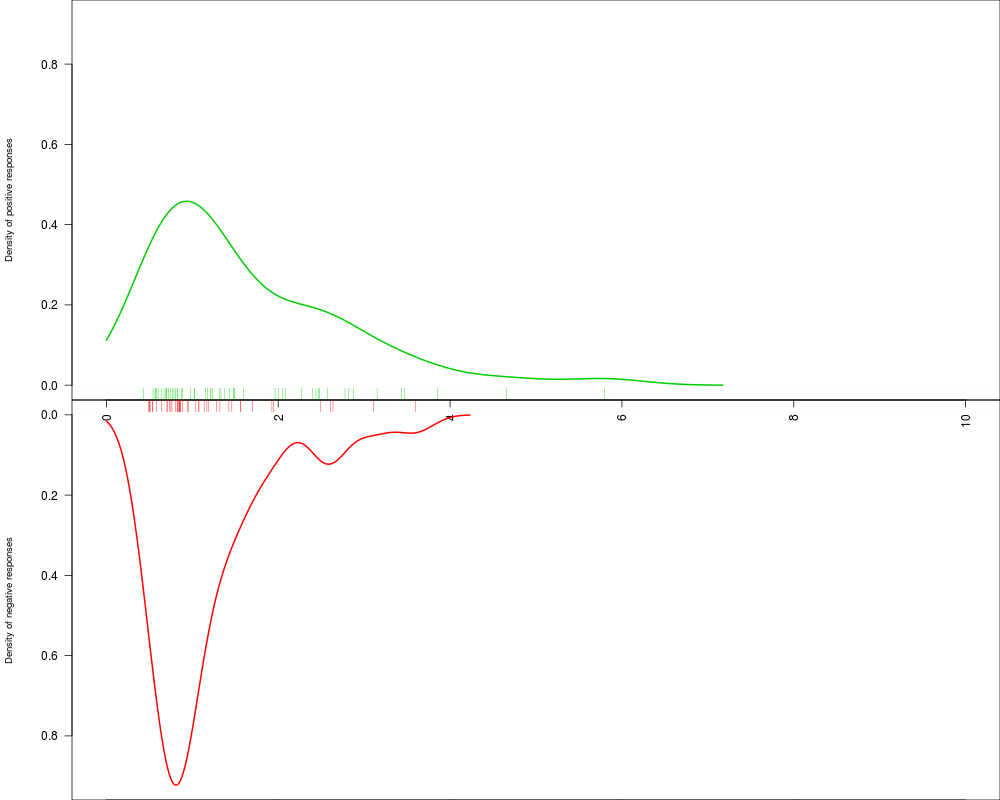
wiener_plot creates a density plot of correct and wrong responses
for a given dataset.
Usage
wiener_plot(dat)
Arguments
dat
dataframe with data. Needs a reaction time column and a
accuracy/response column.
Examples
# generate random data
dat <- rwiener(100,2,.3,.5,0)

# plot
wiener_plot(dat)
Results
R version 3.3.1 (2016-06-21) -- "Bug in Your Hair"
Copyright (C) 2016 The R Foundation for Statistical Computing
Platform: x86_64-pc-linux-gnu (64-bit)

R is free software and comes with ABSOLUTELY NO WARRANTY.
You are welcome to redistribute it under certain conditions.
Type 'license()' or 'licence()' for distribution details.

R is a collaborative project with many contributors.
Type 'contributors()' for more information and
'citation()' on how to cite R or R packages in publications.

Type 'demo()' for some demos, 'help()' for on-line help, or
'help.start()' for an HTML browser interface to help.
Type 'q()' to quit R.

> library(RWiener)
> png(filename="/home/ddbj/snapshot/RGM3/R_CC/result/RWiener/wiener_plot.Rd_%03d_medium.png", width=480, height=480)
> ### Name: wiener plot
> ### Title: Wiener plot function
> ### Aliases: wiener_plot
> ### Keywords: wiener_plot
>
> ### ** Examples
>
> # generate random data
> dat <- rwiener(100,2,.3,.5,0)
>
> # plot
> wiener_plot(dat)
>
>
>
>
>
>
> dev.off()
null device
          1
>
 .
.