Supported by Dr. Osamu Ogasawara and  . . |
|
Last data update: 2014.03.03 |
Additional Methods for Function
|
x |
Can represent either an object of class |
... |
May contain any number of objects of class |
plot.type |
A character string specifying the type of plot to generate, must be one of |
Details
See package vignette and examples (below) for more details about each plotting subtype.
Graphical Parameters
angle-
The slope of shading lines, given as an angle in counter-clockwise degrees (default is
45). This parameter is ignored ifdensity=NULLorNAor whereverfill=FALSEor is ignored (e.g. whenplot.type="individual"or"bars"). Also note that this paramater can represent a list of different angles, with length of the list corresponding to the number ofDVHorDVH.listobjects. back-
A character value specifying the back-facing surface fill method when
xis azDVHobject (the parameter is otherwise ignored). Value must be one of"filled","lines","points", or"culled". Default value is assigned from input parameterfront. center-
A character value specifying where to plot the center of a group when
plot.type="grouped"(the parameter is otherwise ignored). Value must be one of"mean"or"median". Note: As of package v.1.0.3, this parameter is considered defunct and will be disregarded accordingly. col-
The color to be used for drawing lines. This parameter can also represent a list of different colors, with length corresponding to the number of
DVH,zDVH, orDVH.listobjects (ifplot.type="individual", number of colors should correspond to number of individualDVHobjects).When
plot.type="bars",colinstead represents a list of colors used to define the shading scheme applied to the entire dose range. Default color scheme is a standard rainbow, with colors ranging from"blue"to"red". Actual default is specified asrev(rainbow(n=10, start=0, end=2/3)). Seecolorsfor more options and information. density-
The density of shading lines, in lines per inch. The default value of
NULLmeans that no shading lines are drawn. A zero value ofdensitymeans no shading nor filling, whereas negative values andNAsuppress shading lines but allow solid color filling. Note that this paramater can also represent a list of different densities, with length of the list corresponding to the number ofDVHorDVH.listobjects. fill-
Logical, defaulting to
TRUE. Determines whether or not to draw shading around groups of DVH lines. Note that this parameter is relevant whenplot.type="grouped","ttest"or"wilcox"(it is ignored whenplot.type="individual"or"bars"). fill.lty-
The line type used for shading (per
densityandangleparameters). Seeltyabove for further specifications of line types. Note that this paramater can represent a list of different line types, with length corresponding to the number ofDVHorDVH.listobjects. fill.transparency-
Factor modifying the transparency of filling/shading (value must be between
[0,1]), withfill.transparency=0specifying complete transparency and1specifying complete opacity. Note that this parameter can represent a list of different transparency factors, with length corresponding to the number ofDVHorDVH.listobjects. Default value isline.transparency/2. front-
A character value specifying the front-facing surface fill method when
xis azDVHobject (the parameter is otherwise ignored). Value must be one of"filled"(default),"lines","points", or"culled". grid-
Logical, defaulting to
FALSE. Determines whether or not to draw gridlines on 2D plot. Note that this parameter is relevant whenplot.type="individual","grouped","ttest", or"wilcox"(it is ignored whenplot.type="bars"or when plottingzDVHobjects). highlight-
The color to be used for shading p-value data when
plot.type="ttest"or"wilcox". Seecolorsfor more options and information. legend-
Value specifying the location to draw a figure legend, must be one of
"topright","bottomright","bottom","bottomleft","left","topleft","top","right", or"center". These keywords place the legend on the inside of the plot frame at the location specified. Partial argument matching is used. Iflegend=NA(default), the legend is not drawn.When
plot.type="bars",legendis interpreted instead as a logical value and must be eitherTRUE(default) orFALSE. IfTRUE, labels are drawn at the bottom of the plot, outside of the actual plotting frame.Note that
legendparameter is ignored whenplot.type="wilcox"andpanel.lower="difference". legend.labels-
A character or
expressionvector specifying the text to appear in the legend, when relevant. Length oflegend.labelsmust match the numer ofDVHandDVH.listobjects, otherwise legend text will default to the form:"Group 1", "Group 2", ... line.transparency-
Factor modifying the transparency of line drawings (value must be between
[0,1]), withfill.transparency=0specifying complete transparency and1(default) specifying complete opacity. Note that this parameter can represent a list of different transparency factors, with length corresponding to the number ofDVHorDVH.listobjects (ifplot.type="individual", number of transparency factors should correspond to number of individualDVHobjects). lty-
The line type. Line types can either be specified as an integer (0=blank, 1=solid (default), 2=dashed, 3=dotted, 4=dotdash, 5=longdash, 6=twodash) or as one of the character strings
"blank","solid","dashed","dotted","dotdash","longdash", or"twodash", where"blank"uses 'invisible lines' (i.e., does not draw them).Alternatively, a string of up to 8 characters (from c(1:9, "A":"F")) may be given, giving the length of line segments which are alternatively drawn and skipped (see
parfor more details). Note that this paramater can also represent a list of different line types, with length corresponding to the number ofDVHorDVH.listobjects (ifplot.type="individual", number of line types should correspond to number of individualDVHobjects). lwd-
The line width, a emphpositive number, defaulting to
1. The interpretation is device-specific, and some devices do not implement line widths less than one (see the help on the device for details of the interpretation). Note that this paramater can also represent a list of different line widths, with length of the list corresponding to the number ofDVHorDVH.listobjects (ifplot.type="individual", number of line widths should correspond to number of individualDVHobjects). main-
An overall title for the plot (see
title, default is""). multiplier-
A single numerical value (default is
1) specifying the degree to which group display width should be shrunken or magnified. This parameter is only processed whenplot.type="grouped"or"ttest"andwidth="mad","sd", or"var". new-
Logical, defaulting to
TRUE. If set toFALSE, the next high-level plotting command (actuallyplot.new) should not clean the frame before drawing as if it were on a new device. It is an error (ignored with a warning) to try to usenew=FALSEon a device that does not currently contain a high-level plot. panel.lower-
Value specifying the lower panel plot content when
plot.type="wilcox"(panel.lowermust be one of"grouped"or"wilcox"[default]). Partial argument matching is used. Whenpanel.lower="wilcox", the median groupwise differences will be displayed with associated confidence intervals obtained fromwilcox.test(). Whenpanel.lower="grouped", the individual groups are displayed with surrounding user-specified intervals (seewidth,quantile, andmultiplierparameters). quantile-
A numeric vector containing two values in [0,1] (default is the interquartile range:
(0.25, 0.75)), specifying the lower and upper probabilities (respectively) to be used whenwidth="quantile"andplot.type="grouped"or"ttest". Seequantilefor more details. width-
A character vector specifying the width of shading to use, when relevant (for a group of DVHs). Value must be one of
"range"(default),"mad","IQR","quantile","var", or"sd", specifying the absolute range, the mean-absolute-deviation, the interquartile (25-75%) range, the arbitrary inter-quantile range (seequantileparameter), the group variance, or standard deviation, respectively. This parameter is ignored unlessplot.type="grouped". Ifplot.type="ttest", the parameter can be optionally specified (ifwidth=NULL(default), shading will default to the confidence interval). xlim-
A numeric vector of length 2 specifying the minimum and maximum x coordinates for plotting (note that this parameter is ignored when
plot.type="bars",new=FALSE, or plotting object(s) of classzDVH). ylim-
A numeric vector of length 2 specifying the minimum and maximum y coordinates for plotting (note that this parameter is ignored when
plot.type="bars",new=FALSE, or plotting object(s) of classzDVH).
Additional Parameters
dose-
Value specifying dose scale (must be one of
"relative"or"absolute"). dose.units-
Value specifying dose units (must be one of
"cGy"or"Gy"). paired-
A logical value (default is
FALSE) specifying whether or not to perform paired groupwise comparisons whenplot.type="ttest"or"wilcox". type-
Value specifying type of dose-volume histogram to plot (must be one of
"cumulative"or"differential"). volume-
Value specifying volume scale (must be one of
"relative"or"absolute").
See Also
plot
Examples
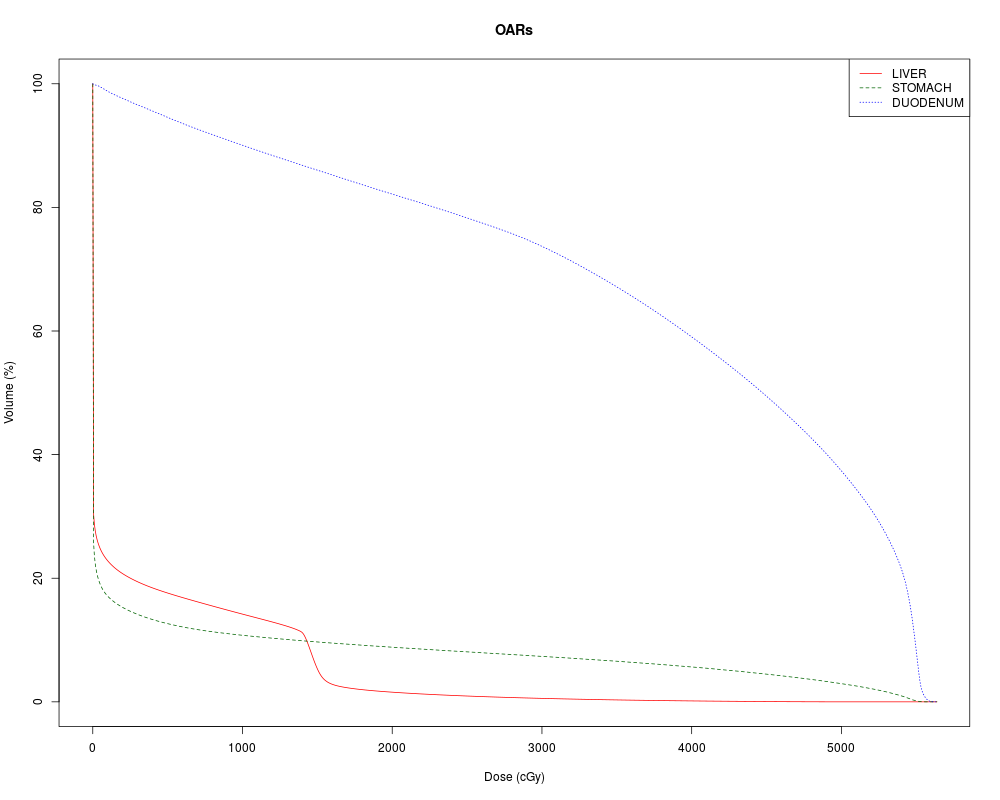
# plot(x, ..., plot.type="individual")
OARs <- c("LIVER","STOMACH","DUODENUM")
cols <- c("red", "darkgreen", "blue")
plot(johndoe[OARs], col=cols, lty=1:3, legend="topright", legend.labels=OARs, main="OARs")
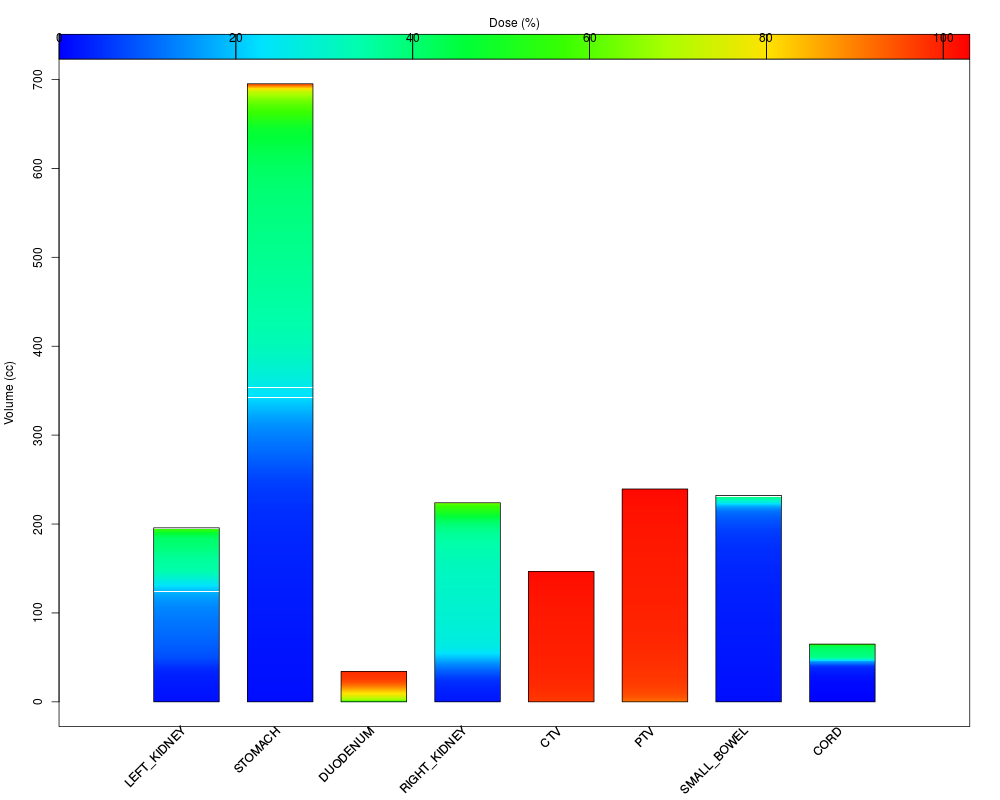
# plot(x, ..., plot.type="bars")
plot(janedoe[2:9], plot.type="bars", volume="absolute",dose="relative")
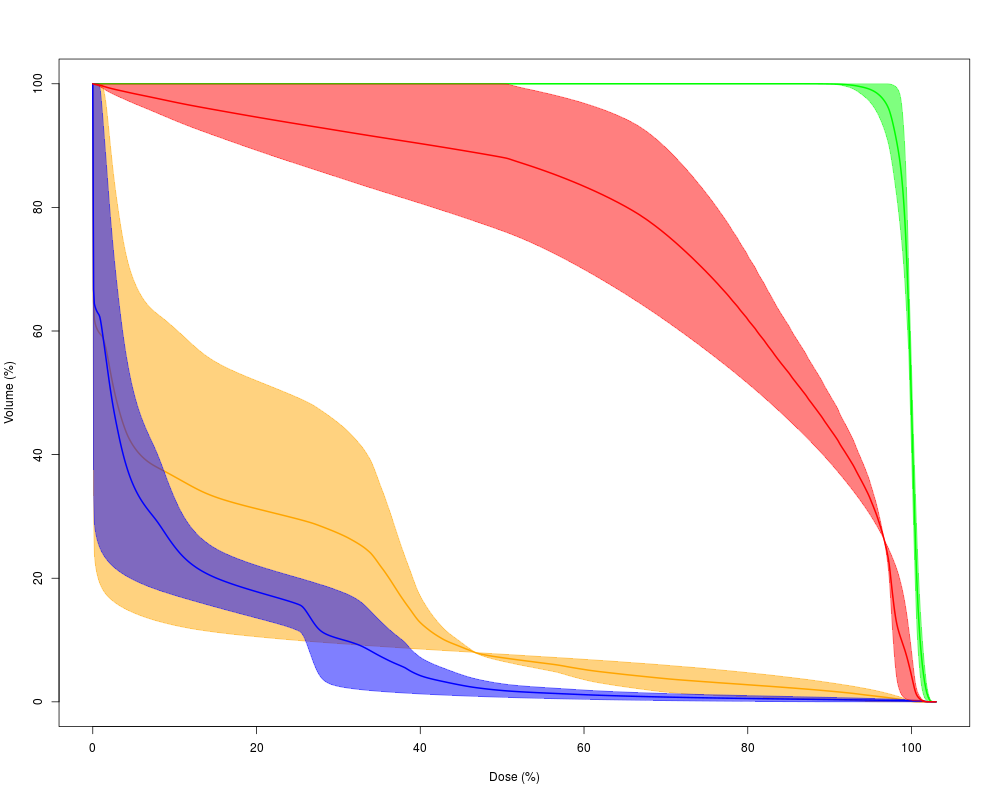
# plot(x, ..., plot.type="grouped")
plot(c(johndoe["STOMACH"],janedoe["STOMACH"]), #group 1
c(johndoe[c("CTV","PTV")],janedoe[c("CTV","PTV")]), #group 2
c(janedoe["LIVER"],johndoe["LIVER"]), #group 3
c(johndoe["DUODENUM"],janedoe["DUODENUM"]), #group 4
plot.type="grouped", col=c("orange","green","blue","red"), lwd=2, dose="relative")
# plot(x, ..., plot.type="ttest")
# OARs <- c("LIVER", "STOMACH", "SMALL_BOWEL")
# plot(c(johndoe[c("CTV","PTV")],janedoe[c("CTV","PTV")]), #group 1
# c(janedoe[OARs],johndoe[OARs]), #group 2
# plot.type="t", col=c("red", "blue"), lty=2, fill.lty=1, main="Target v. OAR t-Test")
# plot(x, ..., plot.type="wilcox")
# plot(c(johndoe[c("CTV","PTV")],janedoe[c("CTV","PTV")]), #group 1
# c(janedoe[OARs],johndoe[OARs]), #group 2
# plot.type="w", col=c("red", "blue"), lty=2, fill.lty=1, main="Target v. OAR",
# panel.lower="grouped")
Results
R version 3.3.1 (2016-06-21) -- "Bug in Your Hair"
Copyright (C) 2016 The R Foundation for Statistical Computing
Platform: x86_64-pc-linux-gnu (64-bit)

R is free software and comes with ABSOLUTELY NO WARRANTY.
You are welcome to redistribute it under certain conditions.
Type 'license()' or 'licence()' for distribution details.

R is a collaborative project with many contributors.
Type 'contributors()' for more information and
'citation()' on how to cite R or R packages in publications.

Type 'demo()' for some demos, 'help()' for on-line help, or
'help.start()' for an HTML browser interface to help.
Type 'q()' to quit R.

> library(RadOnc)
Loading required package: rgl
Loading required package: geometry
Loading required package: magic
Loading required package: abind
Loading required package: oro.dicom

oro.dicom: Rigorous - DICOM Input / Output (version = 0.5.0)

Loading required package: ptinpoly
Loading required package: misc3d
> png(filename="/home/ddbj/snapshot/RGM3/R_CC/result/RadOnc/plot-methods.Rd_%03d_medium.png", width=480, height=480)
> ### Name: plot-methods
> ### Title: Additional Methods for Function 'plot' in Package 'graphics'
> ### Aliases: plot-methods plot,ANY,ANY-method plot,DVH.list,ANY-method
> ###   plot,DVH.list,missing-method plot,DVH,ANY-method plot,DVH,DVH-method
> ###   plot,DVH,missing-method plot,zDVH,ANY-method plot,zDVH,DVH-method
> ###   plot,DVH,zDVH-method plot,zDVH,zDVH-method plot.DVH plot.DVH.list
> ###   plot.zDVH plot,zDVH,missing-method
> ### Keywords: methods aplot
>
> ### ** Examples
>
> 	# plot(x, ..., plot.type="individual")
> 	OARs <- c("LIVER","STOMACH","DUODENUM")
> 	cols <- c("red", "darkgreen", "blue")
> 	plot(johndoe[OARs], col=cols, lty=1:3, legend="topright", legend.labels=OARs, main="OARs")
>
> 	# plot(x, ..., plot.type="bars")
> 	plot(janedoe[2:9], plot.type="bars", volume="absolute",dose="relative")
>
> 	# plot(x, ..., plot.type="grouped")
> 	plot(c(johndoe["STOMACH"],janedoe["STOMACH"]), #group 1
+ 		c(johndoe[c("CTV","PTV")],janedoe[c("CTV","PTV")]), #group 2
+ 		c(janedoe["LIVER"],johndoe["LIVER"]), #group 3
+ 		c(johndoe["DUODENUM"],janedoe["DUODENUM"]), #group 4
+ 		plot.type="grouped", col=c("orange","green","blue","red"), lwd=2, dose="relative")
>
> 	# plot(x, ..., plot.type="ttest")
> 	# OARs <- c("LIVER", "STOMACH", "SMALL_BOWEL")
> 	# plot(c(johndoe[c("CTV","PTV")],janedoe[c("CTV","PTV")]), #group 1
> 	#	c(janedoe[OARs],johndoe[OARs]), #group 2
>  	#	plot.type="t", col=c("red", "blue"), lty=2, fill.lty=1, main="Target v. OAR t-Test")
>
> 	# plot(x, ..., plot.type="wilcox")
> 	# plot(c(johndoe[c("CTV","PTV")],janedoe[c("CTV","PTV")]), #group 1
> 	#	c(janedoe[OARs],johndoe[OARs]), #group 2
>  	#	plot.type="w", col=c("red", "blue"), lty=2, fill.lty=1, main="Target v. OAR",
>  	#	panel.lower="grouped")
>
>
>
>
>
> dev.off()
null device
          1
>
|