Supported by Dr. Osamu Ogasawara and  . . |
|
Last data update: 2014.03.03 |
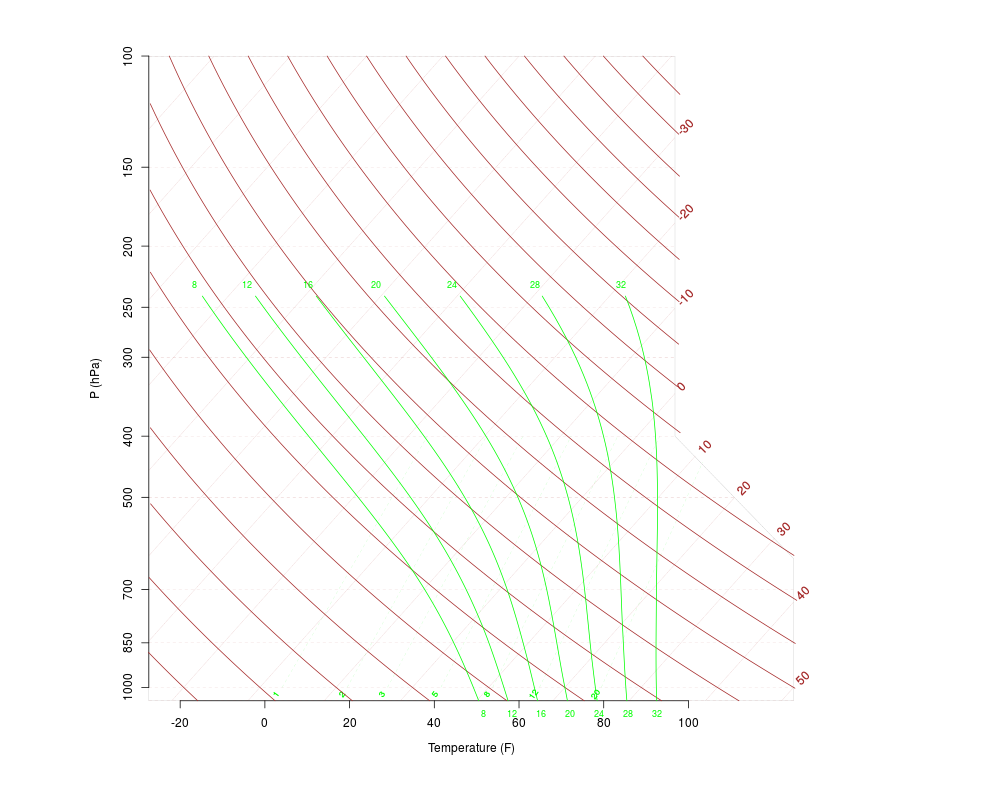
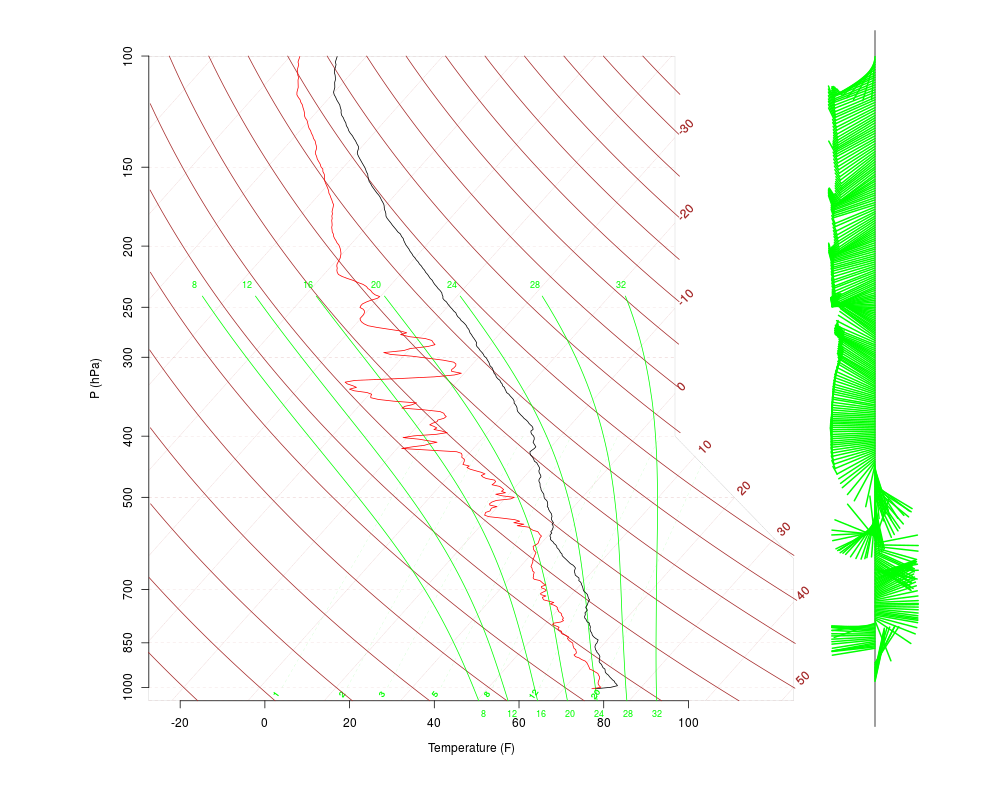
Creates a SKEW-T, log p diagram for a radiosonde dataframe.DescriptionCreates a SKEW-T, log p diagram with dry-bulb temperature and dewpoint temperature traces versus (log) pressure. Optionally plots the vertical wind profile using wind barbs. Usage plotsonde(dataframe, skewT=TRUE, winds=FALSE, site="", title="",
windplot=NULL, s=3, col=c(1, 2), ... )
Arguments
ValueNo value returned. Creates a skewt plot. Note that default is temperature horizontal scale is Farenheit. Author(s)Doug Nychka, Eric Gilleland, References1. Department of Defense, 1969, "USAF SKEW-T, log p DIAGRAM," DOD-WPC-9-16-1, Aeronautical Chart and Information Center, United States Air Force, St. Louis, Missouri 63118. 2. List, R.J. (editor), 1958, Smithsonian Meteorological Tables, Smithsonian Institute, Washington, D.C. 3. Nordquist, W.S., 1973, "Numerical Approximations of Selected Meteorological Parameters for Cloud Physics Problems," ECOM-5475, Atmospheric Sciences Laboratory, US Army Electronics Command, White Sands Missile Range, New Mexico 88002. 4. Stipanuk, G.S., 1973, "Algorithms for Generating a SKEW-T, log p Diagram and Computing Selected Meteorological Quantities," American Sciences Laboratory, US Army Electronics Command, White Sands Missile Range, New Mexico 88002. 5. http://www.atd.ucar.edu/dir_off/tc_corr/index.html 6. http://weather.unisys.com/upper_air/skew/details.html See Also
Examplesdata(ExampleSonde) plotsonde(ExampleSonde, winds=TRUE) Results
R version 3.3.1 (2016-06-21) -- "Bug in Your Hair"
Copyright (C) 2016 The R Foundation for Statistical Computing
Platform: x86_64-pc-linux-gnu (64-bit)

R is free software and comes with ABSOLUTELY NO WARRANTY.
You are welcome to redistribute it under certain conditions.
Type 'license()' or 'licence()' for distribution details.

R is a collaborative project with many contributors.
Type 'contributors()' for more information and
'citation()' on how to cite R or R packages in publications.

Type 'demo()' for some demos, 'help()' for on-line help, or
'help.start()' for an HTML browser interface to help.
Type 'q()' to quit R.

> library(RadioSonde)
> png(filename="/home/ddbj/snapshot/RGM3/R_CC/result/RadioSonde/plotsonde.Rd_%03d_medium.png", width=480, height=480)
> ### Name: plotsonde
> ### Title: Creates a SKEW-T, log p diagram for a radiosonde dataframe.
> ### Aliases: plotsonde
> ### Keywords: hplot aplot
>
> ### ** Examples
>
> data(ExampleSonde)
> plotsonde(ExampleSonde, winds=TRUE)
[1] 0.800 0.950 0.153 0.937
>
>
>
>
>
> dev.off()
null device
          1
>
|