Supported by Dr. Osamu Ogasawara and  . . |
|
Last data update: 2014.03.03 |
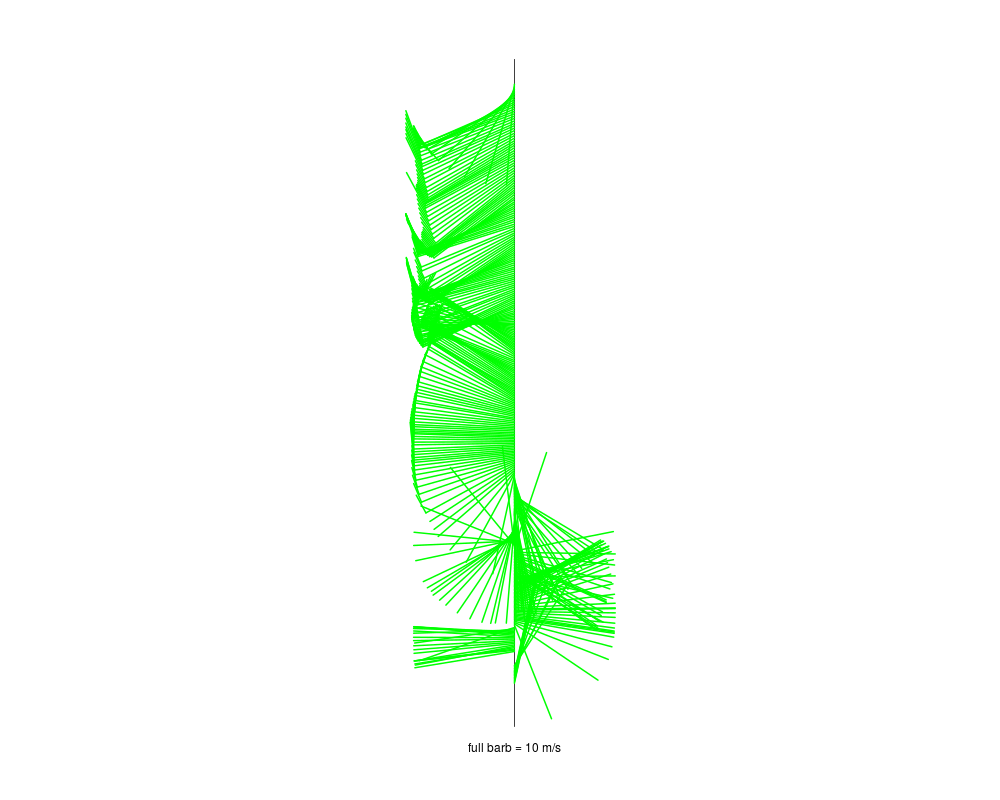
Winds Profile PlotDescriptionCreates a wind profile in the standard atmospheric notation. Each full barb = 10 m/s, half barb = 5 m/s, and a filled triangle for 50 m/s. The maximum wind speed that can be plotted without amending the program is 65 m/s. Usageplotwind(dataframe, size=5, ylim=c(1050, 100), legend=FALSE) Arguments
Details the dataframe must have components for wind speed ValueNone – creates a plot. Author(s)Doug Nychka, Eric Gilleland See Also
Examples# Example 1: data(ExampleSonde) plotwind(ExampleSonde) # Example 2: plotwind(ExampleSonde, size = 7, legend=TRUE) Results
R version 3.3.1 (2016-06-21) -- "Bug in Your Hair"
Copyright (C) 2016 The R Foundation for Statistical Computing
Platform: x86_64-pc-linux-gnu (64-bit)

R is free software and comes with ABSOLUTELY NO WARRANTY.
You are welcome to redistribute it under certain conditions.
Type 'license()' or 'licence()' for distribution details.

R is a collaborative project with many contributors.
Type 'contributors()' for more information and
'citation()' on how to cite R or R packages in publications.

Type 'demo()' for some demos, 'help()' for on-line help, or
'help.start()' for an HTML browser interface to help.
Type 'q()' to quit R.

> library(RadioSonde)
> png(filename="/home/ddbj/snapshot/RGM3/R_CC/result/RadioSonde/plotwind.Rd_%03d_medium.png", width=480, height=480)
> ### Name: plotwind
> ### Title: Winds Profile Plot
> ### Aliases: plotwind
> ### Keywords: hplot
>
> ### ** Examples
>
> # Example 1:
> data(ExampleSonde)
> plotwind(ExampleSonde)
> # Example 2:
> plotwind(ExampleSonde, size = 7, legend=TRUE)
>
>
>
>
>
> dev.off()
null device
          1
>
|