Supported by Dr. Osamu Ogasawara and  . . |
|
Last data update: 2014.03.03 |
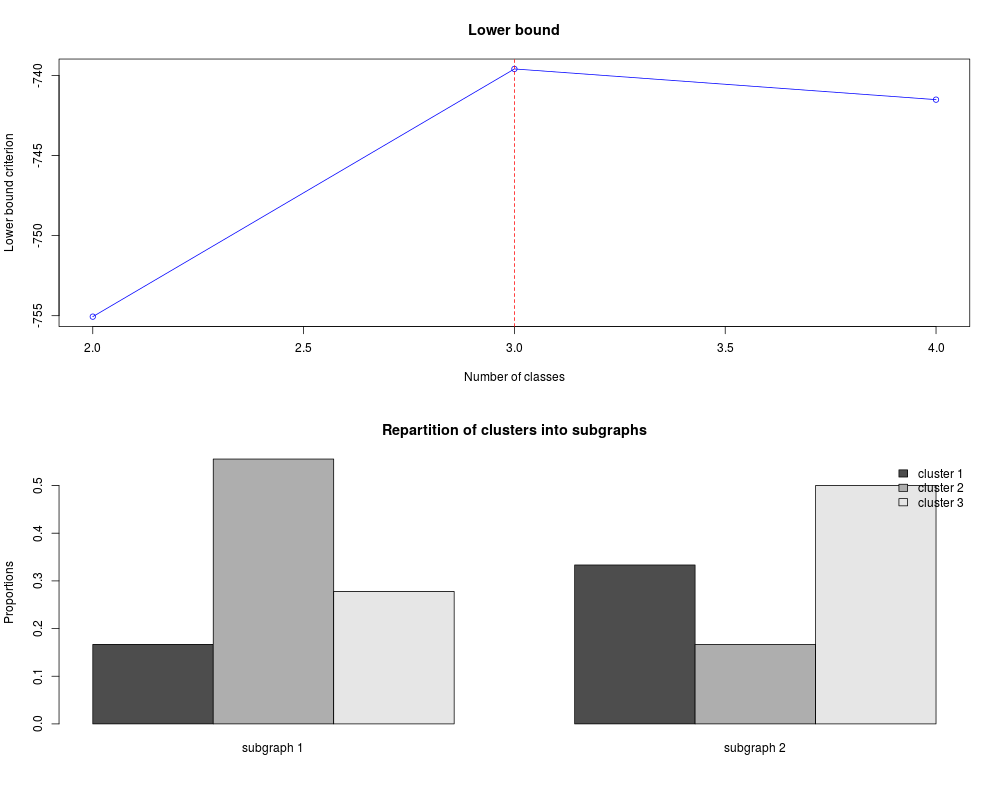
A simulated network with subgraphs and typed edgesDescriptionThe Usagedata(Regions) FormatA list which contains the discrete adjacency matrix (X) of the network and a vector indicating the subgraph belongings of the nodes (sub). ReferencesYacine Jernite, Pierre Latouche, Charles Bouveyron, Patrick Rivera, Laurent Jegou and Stephane Lamasse(2012), The Random Subgraph Model for the Analysis of an Ecclesiastical Network in Merovingian Gaul, http://arxiv.org/abs/1212.5497 Examplesdata(Regions) res <- rsm(Regions$X, Regions$sub, Klist=2:4, nbredo=1, maxit=5) plot(res) Results
R version 3.3.1 (2016-06-21) -- "Bug in Your Hair"
Copyright (C) 2016 The R Foundation for Statistical Computing
Platform: x86_64-pc-linux-gnu (64-bit)

R is free software and comes with ABSOLUTELY NO WARRANTY.
You are welcome to redistribute it under certain conditions.
Type 'license()' or 'licence()' for distribution details.

R is a collaborative project with many contributors.
Type 'contributors()' for more information and
'citation()' on how to cite R or R packages in publications.

Type 'demo()' for some demos, 'help()' for on-line help, or
'help.start()' for an HTML browser interface to help.
Type 'q()' to quit R.

> library(Rambo)
Loading required package: sna
sna: Tools for Social Network Analysis
Version 2.3-2 created on 2014-01-13.
copyright (c) 2005, Carter T. Butts, University of California-Irvine
 For citation information, type citation("sna").
 Type help(package="sna") to get started.

> png(filename="/home/ddbj/snapshot/RGM3/R_CC/result/Rambo/Regions.Rd_%03d_medium.png", width=480, height=480)
> ### Name: Regions
> ### Title: A simulated network with subgraphs and typed edges
> ### Aliases: Regions
> ### Keywords: rsm subgraph Regions
>
> ### ** Examples
>
> data(Regions)
> res <- rsm(Regions$X, Regions$sub, Klist=2:4, nbredo=1, maxit=5)
> plot(res)
>
>
>
>
>
> dev.off()
null device
          1
>
|
Created & Maintained by Osamu Ogasawara (osamu.ogasawara@gmail.com) and 