R version 3.3.1 (2016-06-21) -- "Bug in Your Hair"
Copyright (C) 2016 The R Foundation for Statistical Computing
Platform: x86_64-pc-linux-gnu (64-bit)
R is free software and comes with ABSOLUTELY NO WARRANTY.
You are welcome to redistribute it under certain conditions.
Type 'license()' or 'licence()' for distribution details.
R is a collaborative project with many contributors.
Type 'contributors()' for more information and
'citation()' on how to cite R or R packages in publications.
Type 'demo()' for some demos, 'help()' for on-line help, or
'help.start()' for an HTML browser interface to help.
Type 'q()' to quit R.
> library(Rambo)
Loading required package: sna
sna: Tools for Social Network Analysis
Version 2.3-2 created on 2014-01-13.
copyright (c) 2005, Carter T. Butts, University of California-Irvine
For citation information, type citation("sna").
Type help(package="sna") to get started.
> png(filename="/home/ddbj/snapshot/RGM3/R_CC/result/Rambo/plot.rsm.Rd_%03d_medium.png", width=480, height=480)
> ### Name: plot.rsm
> ### Title: Plot an object from class rsm
> ### Aliases: plot.rsm
>
> ### ** Examples
>
> data(Regions)
> res <- rsm(Regions$X, Regions$sub, Klist=2:4, nbredo=1, maxit=5)
> ##plot(res, frame=0)
> ## plot(res, frame=1)
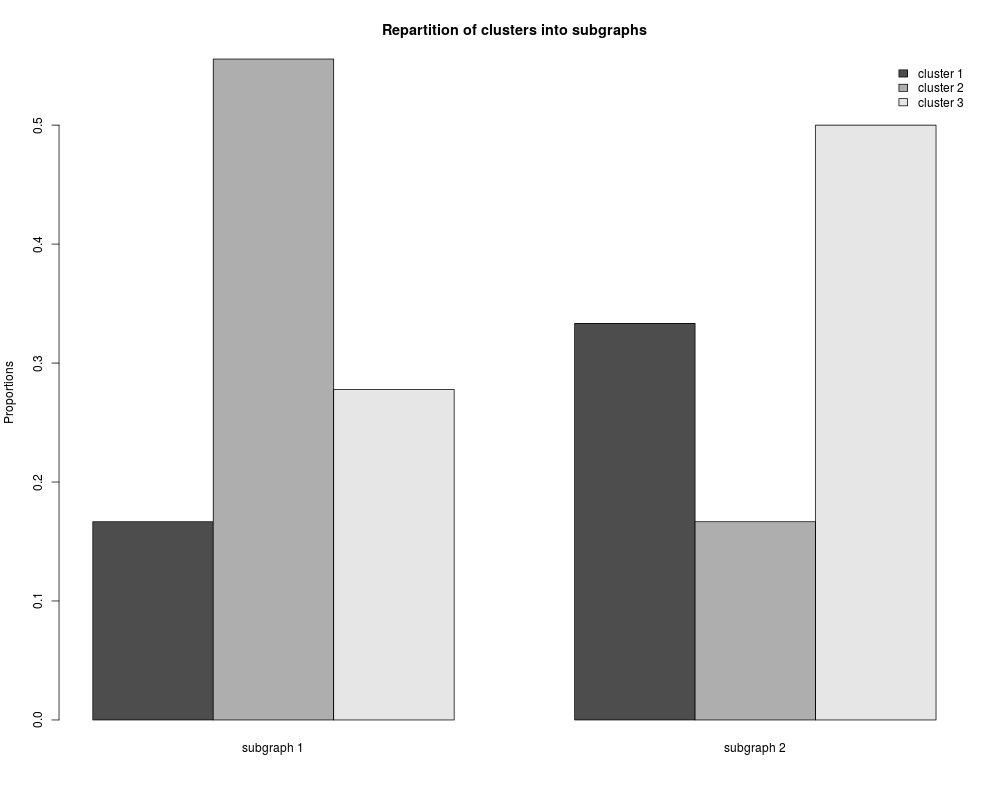
> plot(res, frame=2)
>
>
>
>
>
> dev.off()
null device
1
>
 .
.