Supported by Dr. Osamu Ogasawara and  . . |
|
Last data update: 2014.03.03 |
The Random Subgraph ModelDescriptionPartition the vertices of a directed network with typed edges into clusters describing the connection patterns of subgraphs given as inputs. The inference is performed using a variational Bayes EM algorithm and the estimation of the number of clusters is obtained through a variational approximation of the marginal log likelihood. Usagersm(X, sub, Klist, nbredo = 5, disp = F, maxit = 50) Arguments
Details
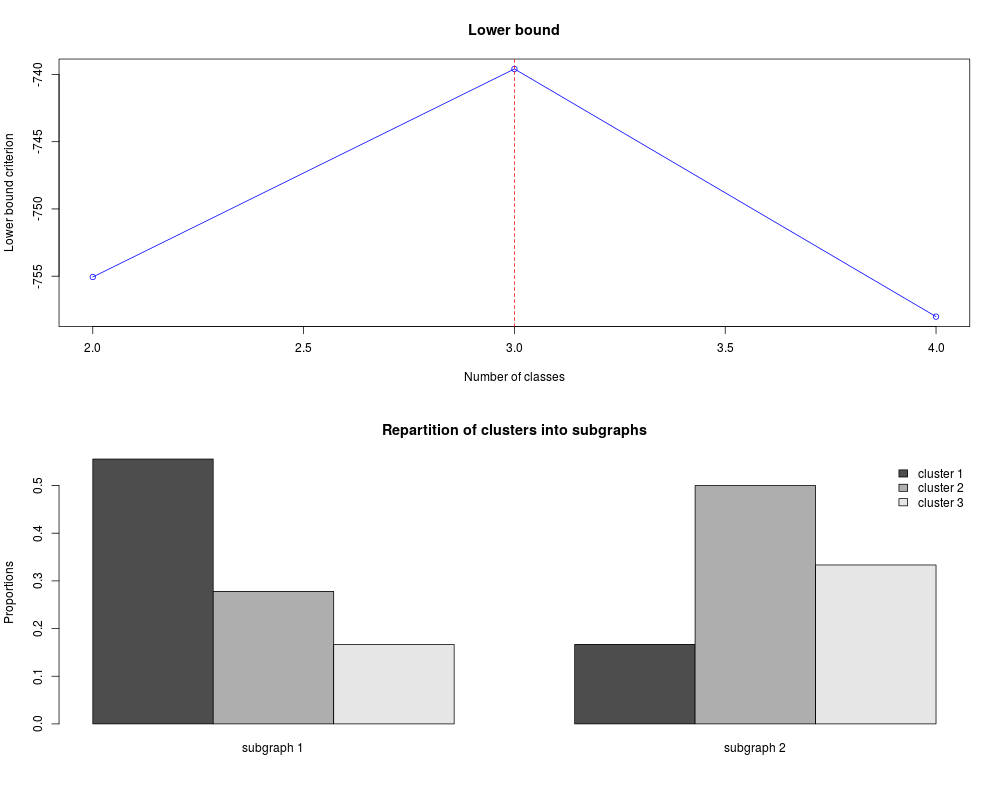
The RSM model assumes that the presence of an edge between two vertices depends on the subgraphs they belong to. If an edge is present, its type is then assumed to be sampled from a multinomial distribution, depending on latent clusters. In practice, the subgraphs are known and given as inputs while the clusters have to be infered from the data. The clustering of the vertices is performed using a variational Bayes algorithm and the number of clusters is obtained with a model selection criterion which is a variational approximation of the marginal log likelihood. The algorithm is runned for various values of the number of clusters (Klist). For each value of K in Klist, the algorithm is initialized Assuming that the number of clusters is K, In order to have a better chance of reaching a global optimum, VBEM is run for several initializations of a kmeans like algorithm (by default, ValueReturns a list including:
Author(s)Yacine Jernite, Laetitia Nouedoui, Charles Bouveyron, Pierre Latouche. ReferencesYacine Jernite, Pierre Latouche, Charles Bouveyron, Patrick Rivera, Laurent Jegou and Stephane Lamasse(2012), The Random Subgraph Model for the Analysis of an Ecclesiastical Network in Merovingian Gaul, http://arxiv.org/abs/1212.5497 See Also
Examplesdata(Regions) res <- rsm(Regions$X, Regions$sub, Klist=2:4, nbredo=1, maxit=5) plot(res) summary(res) Results
R version 3.3.1 (2016-06-21) -- "Bug in Your Hair"
Copyright (C) 2016 The R Foundation for Statistical Computing
Platform: x86_64-pc-linux-gnu (64-bit)

R is free software and comes with ABSOLUTELY NO WARRANTY.
You are welcome to redistribute it under certain conditions.
Type 'license()' or 'licence()' for distribution details.

R is a collaborative project with many contributors.
Type 'contributors()' for more information and
'citation()' on how to cite R or R packages in publications.

Type 'demo()' for some demos, 'help()' for on-line help, or
'help.start()' for an HTML browser interface to help.
Type 'q()' to quit R.

> library(Rambo)
Loading required package: sna
sna: Tools for Social Network Analysis
Version 2.3-2 created on 2014-01-13.
copyright (c) 2005, Carter T. Butts, University of California-Irvine
 For citation information, type citation("sna").
 Type help(package="sna") to get started.

> png(filename="/home/ddbj/snapshot/RGM3/R_CC/result/Rambo/rsm.Rd_%03d_medium.png", width=480, height=480)
> ### Name: rsm
> ### Title: The Random Subgraph Model
> ### Aliases: rsm
> ### Keywords: subgraph rsm
>
> ### ** Examples
>
> data(Regions)
> res <- rsm(Regions$X, Regions$sub, Klist=2:4, nbredo=1, maxit=5)
> plot(res)
> summary(res)
Initial settings:
 30 vertices
 2 subgraphs
 3 relations types

 The optimal number of cluster is K =  3 ;
 with the lower bound equal:  -739.5941
>
>
>
>
>
> dev.off()
null device
          1
>
|