Supported by Dr. Osamu Ogasawara and  . . |
|
Last data update: 2014.03.03 |
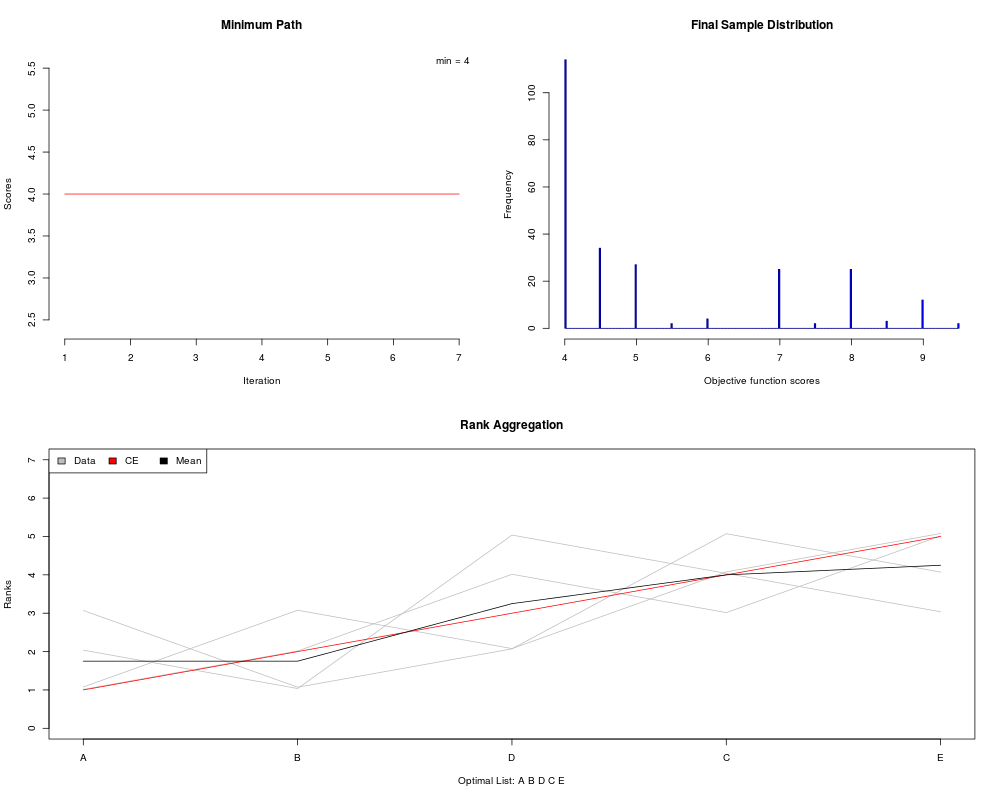
Plot function for raggr object returned by RankAggreg or BruteAggregDescriptionPlots individual ordered lists with the corresponding solution. Optionally, naive average rank aggregation can be added. Usage## S3 method for class 'raggr' plot(x, show.average = TRUE, show.legend = TRUE, colR="red", ...) Arguments
DetailsThe function plots individual lists and the solution using ranks only (weights are not used at any time). Optional average rank aggregation can be performed and visualized. Average rank aggregation is a simple aggregation procedure which computes the average ranks for each unique element accross and orders them from the smallest to the largest value. ValueNothing is returned Author(s)Vasyl Pihur, Somnath Datta, Susmita Datta ReferencesPihur, V., Datta, S., and Datta, S. (2007) "Weighted rank aggregation of cluster validation measures: a Monte Carlo cross-entropy approach" Bioinformatics, 23(13):1607-1615 See Also
Examples
# rank aggregation without weights
x <- matrix(c("A", "B", "C", "D", "E",
        "B", "D", "A", "E", "C",
        "B", "A", "E", "C", "D",
        "A", "D", "B", "C", "E"), byrow=TRUE, ncol=5)

(CES <- RankAggreg(x, 5, method="CE", distance="Spearman", rho=.1, verbose=FALSE))
plot(CES)
Results
R version 3.3.1 (2016-06-21) -- "Bug in Your Hair"
Copyright (C) 2016 The R Foundation for Statistical Computing
Platform: x86_64-pc-linux-gnu (64-bit)

R is free software and comes with ABSOLUTELY NO WARRANTY.
You are welcome to redistribute it under certain conditions.
Type 'license()' or 'licence()' for distribution details.

R is a collaborative project with many contributors.
Type 'contributors()' for more information and
'citation()' on how to cite R or R packages in publications.

Type 'demo()' for some demos, 'help()' for on-line help, or
'help.start()' for an HTML browser interface to help.
Type 'q()' to quit R.

> library(RankAggreg)
> png(filename="/home/ddbj/snapshot/RGM3/R_CC/result/RankAggreg/plot.raggr.Rd_%03d_medium.png", width=480, height=480)
> ### Name: plot.raggr
> ### Title: Plot function for raggr object returned by RankAggreg or
> ###   BruteAggreg
> ### Aliases: plot.raggr
> ### Keywords: optimize robust
>
> ### ** Examples
>
> # rank aggregation without weights
> x <- matrix(c("A", "B", "C", "D", "E",
+         "B", "D", "A", "E", "C",
+         "B", "A", "E", "C", "D",
+         "A", "D", "B", "C", "E"), byrow=TRUE, ncol=5)
>
> (CES <- RankAggreg(x, 5, method="CE", distance="Spearman", rho=.1, verbose=FALSE))
The optimal list is:
        A B D C E

  Algorithm:   CE
  Distance:    Spearman
  Score:       4
> plot(CES)
>
>
>
>
>
> dev.off()
null device
          1
>
|