Supported by Dr. Osamu Ogasawara and  . . |
|
Last data update: 2014.03.03 |
Point and Interval RearrangementDescriptionThis package implements the rearrangement operator (Hardy, Littlewood, and Polya 1952) for univariate, bivariate, and trivariate point estimates of monotonic functions. It additionally provides a function that creates simultaneous confidence intervals for univariate functions and applies the rearrangement operator to these confidence intervals. Details
This package is used for rearranging both point and interval estimates of a target function. Given an original point estimate of a target function, one may use Author(s)Wesley Graybill, Mingli Chen, Victor Chernozhukov, Ivan Fernandez-Val, Alfred Galichon Maintainer: Ivan Fernandez-Val <ivanf@bu.edu> ReferencesChernozhukov, V., I. Fernandez-Val, and a. Galichon. 2009. Improving point and interval estimators of monotone functions by rearrangement. Biometrika 96 (3): 559-575. Chernozhukov, V., I. Fernandez-Val, and a. Galichon. 2010. Quantile and Probability Curves Without Crossing. Econometrica 78(3): 1093-1125. Hardy, G.H., J.E. Littlewood, and G. Polya, Inequalities,2nd ed, Cambridge U. Press,1952 Examples
##rearrangement example:
library(splines)
data(GrowthChart)
attach(GrowthChart)
ages <- unique(sort(age))
aknots <- c(3, 5, 8, 10, 11.5, 13, 14.5, 16, 18)
splines_age <- bs(age,kn=aknots)
sformula <- height~splines_age
sfunc <- approxfun(age,lm(sformula)$fitted.values)
splreg <- sfunc(ages)
rsplreg <- rearrangement(list(ages),splreg)
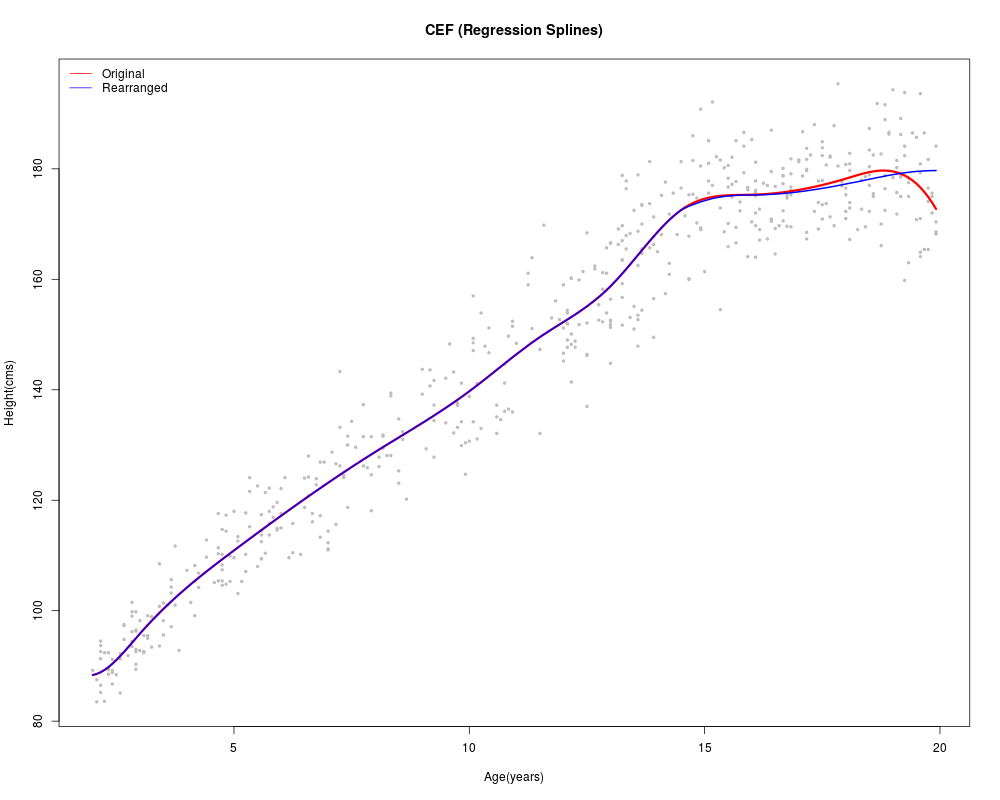
plot(age,height,pch=21,bg='gray',cex=.5,xlab="Age(years)",
ylab="Height(cms)", main="CEF (Regression Splines)",col='gray')
lines(ages,splreg,col='red',lwd=3)
lines(ages,rsplreg,col='blue',lwd=2)
legend("topleft",c('Original','Rearranged'),lty=1,col=c('red','blue'),bty='n')
detach(GrowthChart)
##rconint example:
## Not run:
data(GrowthChart)
attach(GrowthChart)
nage <- 2 * pi * (age - min(age)) / (max(age) - min(age))
formula <- height~I(sin(nage))+I(cos(nage))+I(sin(2*nage)) +
I(cos(2*nage))+I(sin(3*nage))+
I(cos(3*nage))+ I(sin(4*nage)) + I(cos(4*nage))
j <- simconboot(nage,height,lm,formula)
k <- rconint(j)
plot(k, border=NA, col='darkgray')
polygon.conint(j, border=NA, col='lightgray')
polygon.conint(k, border=NA, col='darkgray', density=50)
points(nage,height)
detach(GrowthChart)
## End(Not run)
Results
R version 3.3.1 (2016-06-21) -- "Bug in Your Hair"
Copyright (C) 2016 The R Foundation for Statistical Computing
Platform: x86_64-pc-linux-gnu (64-bit)

R is free software and comes with ABSOLUTELY NO WARRANTY.
You are welcome to redistribute it under certain conditions.
Type 'license()' or 'licence()' for distribution details.

R is a collaborative project with many contributors.
Type 'contributors()' for more information and
'citation()' on how to cite R or R packages in publications.

Type 'demo()' for some demos, 'help()' for on-line help, or
'help.start()' for an HTML browser interface to help.
Type 'q()' to quit R.

> library(Rearrangement)
Loading required package: quantreg
Loading required package: SparseM

Attaching package: 'SparseM'

The following object is masked from 'package:base':

    backsolve

Loading required package: splines
> png(filename="/home/ddbj/snapshot/RGM3/R_CC/result/Rearrangement/Rearrangement-package.Rd_%03d_medium.png", width=480, height=480)
> ### Name: Rearrangement-package
> ### Title: Point and Interval Rearrangement
> ### Aliases: Rearrangement-package Rearrangement
> ### Keywords: package manip datasets regression models
>
> ### ** Examples
>
> ##rearrangement example:
> library(splines)
> data(GrowthChart)
> attach(GrowthChart)
>
> ages <- unique(sort(age))
> aknots <- c(3, 5, 8, 10, 11.5, 13, 14.5, 16, 18)
> splines_age <- bs(age,kn=aknots)
> sformula <- height~splines_age
> sfunc <- approxfun(age,lm(sformula)$fitted.values)
> splreg <- sfunc(ages)
> rsplreg <- rearrangement(list(ages),splreg)
> plot(age,height,pch=21,bg='gray',cex=.5,xlab="Age(years)",
+ ylab="Height(cms)", main="CEF (Regression Splines)",col='gray')
> lines(ages,splreg,col='red',lwd=3)
> lines(ages,rsplreg,col='blue',lwd=2)
> legend("topleft",c('Original','Rearranged'),lty=1,col=c('red','blue'),bty='n')
> detach(GrowthChart)
>
> ##rconint example:
> ## Not run:
> ##D data(GrowthChart)
> ##D attach(GrowthChart)
> ##D
> ##D nage <- 2 * pi * (age - min(age)) / (max(age) - min(age))
> ##D
> ##D formula <- height~I(sin(nage))+I(cos(nage))+I(sin(2*nage)) +
> ##D             I(cos(2*nage))+I(sin(3*nage))+
> ##D             I(cos(3*nage))+ I(sin(4*nage)) + I(cos(4*nage))
> ##D
> ##D j <- simconboot(nage,height,lm,formula)
> ##D k <- rconint(j)
> ##D plot(k, border=NA, col='darkgray')
> ##D polygon.conint(j, border=NA, col='lightgray')
> ##D polygon.conint(k, border=NA, col='darkgray', density=50)
> ##D points(nage,height)
> ##D detach(GrowthChart)
> ## End(Not run)
>
>
>
>
>
> dev.off()
null device
          1
>
|