Supported by Dr. Osamu Ogasawara and  . . |
|
Last data update: 2014.03.03 |
Points Method for Simultaneous Confidence IntervalsDescriptionA method for the Usage## S3 method for class 'conint' points(x, ...) Arguments
DetailsThis is intended for plotting confidence intervals produced by the output of Author(s)Wesley Graybill, Mingli Chen, Victor Chernozhukov, Ivan Fernandez-Val, Alfred Galichon See Also
Examples
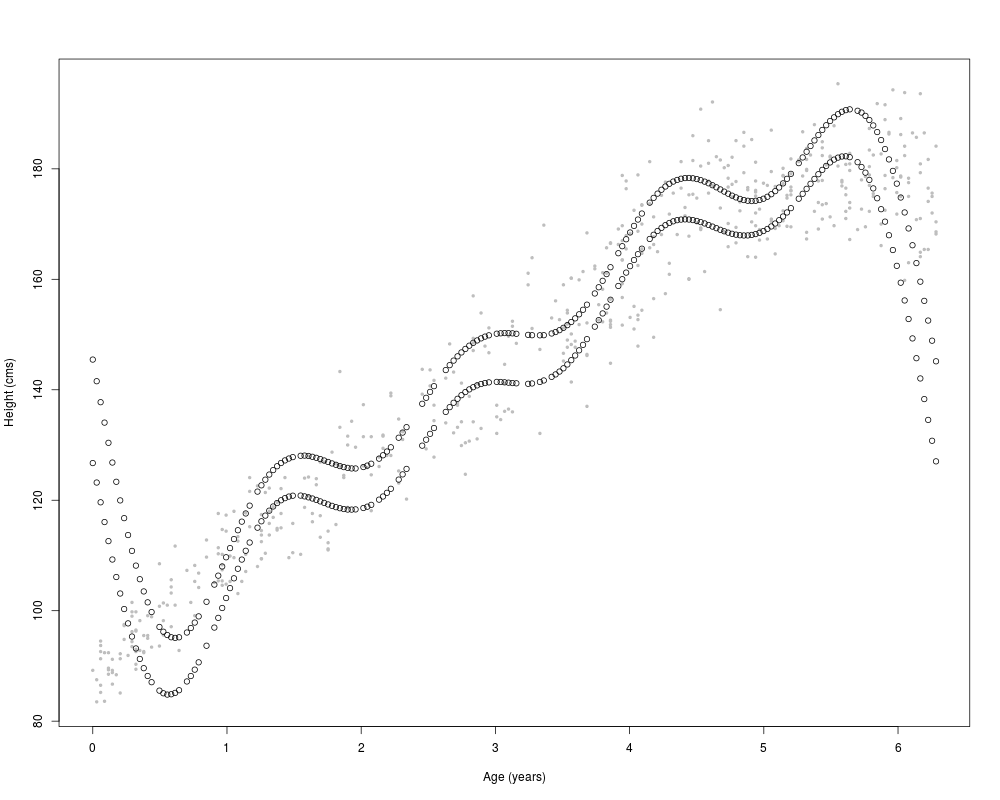
data(GrowthChart)
attach(GrowthChart)

nage <- 2 * pi * (age - min(age)) / (max(age) - min(age))
formula<-height~I(sin(nage))+I(cos(nage))+I(sin(2*nage))+I(cos(2*nage))+
          I(sin(3*nage))+I(cos(3*nage))+I(sin(4*nage))+I(cos(4*nage))
j <- simconboot(nage,height,lm,formula)
plot(nage,height,pch=21,bg='gray',cex=.5,xlab="Age (years)",ylab="Height (cms)",col="gray")
points(j)

detach(GrowthChart)
Results
R version 3.3.1 (2016-06-21) -- "Bug in Your Hair"
Copyright (C) 2016 The R Foundation for Statistical Computing
Platform: x86_64-pc-linux-gnu (64-bit)

R is free software and comes with ABSOLUTELY NO WARRANTY.
You are welcome to redistribute it under certain conditions.
Type 'license()' or 'licence()' for distribution details.

R is a collaborative project with many contributors.
Type 'contributors()' for more information and
'citation()' on how to cite R or R packages in publications.

Type 'demo()' for some demos, 'help()' for on-line help, or
'help.start()' for an HTML browser interface to help.
Type 'q()' to quit R.

> library(Rearrangement)
Loading required package: quantreg
Loading required package: SparseM

Attaching package: 'SparseM'

The following object is masked from 'package:base':

    backsolve

Loading required package: splines
> png(filename="/home/ddbj/snapshot/RGM3/R_CC/result/Rearrangement/points.conint.Rd_%03d_medium.png", width=480, height=480)
> ### Name: points.conint
> ### Title: Points Method for Simultaneous Confidence Intervals
> ### Aliases: points.conint
> ### Keywords: aplot
>
> ### ** Examples
>
> data(GrowthChart)
> attach(GrowthChart)
>
> nage <- 2 * pi * (age - min(age)) / (max(age) - min(age))
> formula<-height~I(sin(nage))+I(cos(nage))+I(sin(2*nage))+I(cos(2*nage))+
+           I(sin(3*nage))+I(cos(3*nage))+I(sin(4*nage))+I(cos(4*nage))
> j <- simconboot(nage,height,lm,formula)
> plot(nage,height,pch=21,bg='gray',cex=.5,xlab="Age (years)",ylab="Height (cms)",col="gray")
> points(j)
>
> detach(GrowthChart)
>
>
>
>
>
> dev.off()
null device
          1
>
|
Created & Maintained by Osamu Ogasawara (osamu.ogasawara@gmail.com) and 