Data frame containing a POSIXct
column date and the marks variable.
OTmissing
Optional data frame with columns start and end
(coerced to POSIXct) giving the beginning and the end of
gaps.
start
An object coerced to POSIXct indicating the beginning of
reliable/usable information. Unless this is a beginning of block
(1-st of January for years), the 1-st block will begin afterstart in order to use only qualified information.
end
An object indicating the end of the reliable/usable
information. Unless this is a end of block (1-st of January for
years), the last block will end beforeend in order to
use only qualified information.
MAX.r
Target number of observations in the blocks. Can be of length
one (same number of observations for all blocks) or of length equal
to the number of blocks, the values being then for the blocks in the
same order. In both cases, the target number may be impossible to
reach because of a smaller number of events in the block. If
infMAX is TRUE, the target number of observations will
be reached by filling if needed with -Inf values. The
rationale for this is that a non-existing event is assumed to have
an arbitrarily small mark.
blockDuration
Duration of the blocks. Can only be "year" for now.
monthGapStat
Logical. Setting it to TRUE will compute statistics
concerning the gaps and return them or show them on a plot.
maxMissingFrac
Maximal fraction of a block duration (between 0 and 1) that can be
missing without leading to a NA aggregated value.
dataFrames
If TRUE, the result will contain data frames similar
to those found in an object with class "Rendata". If
FALSE the result will contain list and vector
objects, similar to those used as inputs in the Renouv
function under the names MAX.data and
MAX.effDuration. Note however, that -Inf values can be
found in these objects when infMAX is TRUE.
infMAX
If FALSE, the target number of values the blocks will generally
not be reached, because the total number of events in a block can be
lower than the target number. Then, the target number value is revised
to the number of found values in each block. If TRUE, the
target number of values is reached by filling the values with
-Inf and the datetimes with (POSIXct) NAs.
plot
If TRUE a simple plot is shown.
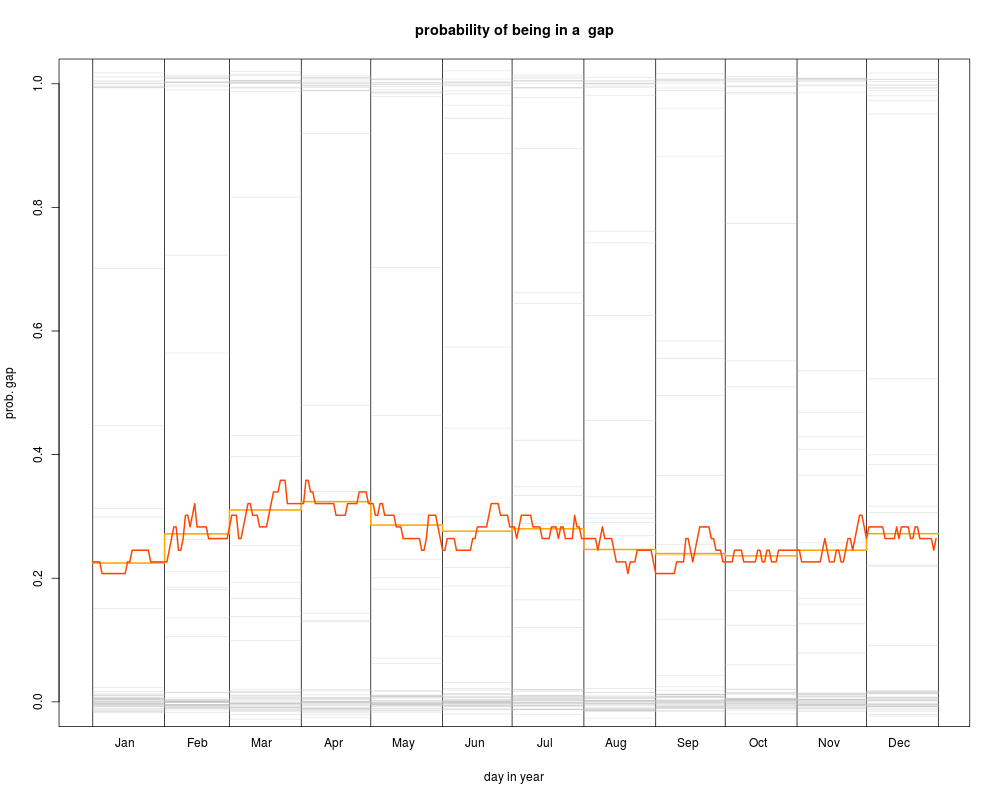
plotType
Character controlling the plot. With "max", the block maxima
are shown. With plotType = "gap", the daily and monthly gap
rates are shown. This is possible when suitable information
concerning gaps is provided in OTmissing. The plot then shows
the probability that a given day of the year falls in a gap, as well
as monthly gap rates. Most often one wants that the gap rate does
not show a seasonal behaviour. Note that gap rates for month-year
combinations are shown as grey segments after jitterizing them since
the values 0 and 1 may be observed for several
years. An alternative way to is using the monthGapTS
multivariate time series returned by the function, see
Examples.
jitterSeed
Random seed for jittering. Used only when plot is
TRUE, plotType is "gap" and when suitable
information is provided in OTmissing.
trace
Integer level of verbosity.
...
Other arguments to be passed to plot.
Details
The data frame given in OTdata contains the events (or
arrivals) given by the date column, as well as one mark
column. Depending on the argument MAX.r, the maxima or the
r-largest observations of the marks is computed for each time
block. When known gaps exist in the data and when they are given in
OTmissing, a block for which the total duration of gaps is too
large will be omitted.
Value
A list, the content of which depends on the value of
dataFrames. If this value is TRUE, the
following elements are returned.
MAXdata
A data frame of largest values by block with one row for
each observation. The largest values are given as columns
with names equal to those in the OTdata data
frame.
MAXinfo
A data frame describing the blocks, with one row by
block. The two (POSIXct) columns "start"
and "end" provide the beginning and the end of the
block. The numeric column duration gives the
effective duration (in year) within block.
probMissing
A vector with values corresponding to the days in a block
(year). Each value is a estimation of the probability
that the day falls in a gap.
If dataFrames is FALSE, the list still
contains probMissing as before, as well as other
lists as used in Renouv.
effDuration, r
Vectors containing the effective duration (in
years) and number of value for the blocks.
data
List of maxima or r-largest values for the blocks.
monthGapStat, monthGapTS
Summary information concerning gaps, if monthGapStat is
TRUE and if relevant information is provide via the the
OTmissing formal. The element monthGapTS is a
multivariate time series with yearly observations and one series
(column) for each of the 12 months. Each series contains the missing
fraction of the month for the considered year, ranging from
0.0 (no gap) to 1.0 (full gap). This object can be
dealt with standard methods for time-series, but the plot
method will require to select a reduced number of columns first,
see Examples.
Note
Remind that even when maxMissingFrac is set to its maximum
value 1.0, there can still be blocks with no data. When the result is
intended to be used in the Renouv function, the formal
dataFrames should be FALSE; the elements data and
effDuration can then be passed as MAX.data and
MAX.effDuration. At the time infMAX should also then be
set to FALSE since -Inf values are not yet allowed in
the r-largest values.
Examples
## use Dunkerque data
OTdata <- Dunkerque$OTdata; OTmissing <- Dunkerque$OTmissing
## allow up to 50% gap in a block, or only 5%
MAX1 <- OT2MAX(OTdata = OTdata, OTmissing = OTmissing,
               maxMissingFrac = 0.5,
               main = "impact of the 'maxMissingFrac' formal")
MAX2 <- OT2MAX(OTdata = OTdata, OTmissing = OTmissing, dataFrames = TRUE,
               prefix = "Max", maxMissingFrac = 0.05, plot = FALSE)
lines(MAX2$MAXdata$date, MAX2$MAXdata$Surge, type = "h", col = "red", lwd = 3)
legend("topleft", lw = c(1, 3), col = c("black", "orangered"),
       legend = c("50% max", " 5% max"))

## r-largest obs for r = 4
MAX3 <- OT2MAX(OTdata, OTmissing = OTmissing, MAX.r = 4,
               maxMissingFrac = 0.9,
               dataFrames = FALSE, trace = TRUE,
               main = "r-largest with r = 4")

## restrict the period
MAX4 <- OT2MAX(OTdata, OTmissing = OTmissing, MAX.r = 4,
               start = "1962-01-01",
               end = "1990-01-01",
               maxMissingFrac = 0.9,
               dataFrames = FALSE, trace = TRUE,
               main = "r-largest with r = 4 with given 'start' and 'end'")
## Not run:
  ## use in a block maxima analysis, as if there were no gaps.
  fit <- fGEV.MAX(MAX.data = MAX3$data,
                  MAX.effDuration = rep(1, length(MAX3$effDuration)))

## End(Not run)
## plot the gap rate
MAX5 <- OT2MAX(OTdata = OTdata, OTmissing = OTmissing,
               maxMissingFrac = 0.5,
               main = "probability of being in a  gap",
               plotType = "gap")

## time series plot (only <= 10 months)
plot(MAX5$monthGapTS[ , c(1:4)], main = "gap rate by month")

## much better with lattice.
## Not run:
    require(lattice)
    xyplot(MAX5$monthGapTS)

## End(Not run)
Results
R version 3.3.1 (2016-06-21) -- "Bug in Your Hair"
Copyright (C) 2016 The R Foundation for Statistical Computing
Platform: x86_64-pc-linux-gnu (64-bit)

R is free software and comes with ABSOLUTELY NO WARRANTY.
You are welcome to redistribute it under certain conditions.
Type 'license()' or 'licence()' for distribution details.

R is a collaborative project with many contributors.
Type 'contributors()' for more information and
'citation()' on how to cite R or R packages in publications.

Type 'demo()' for some demos, 'help()' for on-line help, or
'help.start()' for an HTML browser interface to help.
Type 'q()' to quit R.

> library(Renext)
Loading required package: evd
> png(filename="/home/ddbj/snapshot/RGM3/R_CC/result/Renext/OT2MAX.Rd_%03d_medium.png", width=480, height=480)
> ### Name: OT2MAX
> ### Title: Temporal aggregation of a Marked Process
> ### Aliases: OT2MAX
>
> ### ** Examples
>
> ## use Dunkerque data
> OTdata <- Dunkerque$OTdata; OTmissing <- Dunkerque$OTmissing
> ## allow up to 50% gap in a block, or only 5%
> MAX1 <- OT2MAX(OTdata = OTdata, OTmissing = OTmissing,
+                maxMissingFrac = 0.5,
+                main = "impact of the 'maxMissingFrac' formal")
> MAX2 <- OT2MAX(OTdata = OTdata, OTmissing = OTmissing, dataFrames = TRUE,
+                prefix = "Max", maxMissingFrac = 0.05, plot = FALSE)
> lines(MAX2$MAXdata$date, MAX2$MAXdata$Surge, type = "h", col = "red", lwd = 3)
> legend("topleft", lw = c(1, 3), col = c("black", "orangered"),
+        legend = c("50% max", " 5% max"))
>
> ## r-largest obs for r = 4
> MAX3 <- OT2MAX(OTdata, OTmissing = OTmissing, MAX.r = 4,
+                maxMissingFrac = 0.9,
+                dataFrames = FALSE, trace = TRUE,
+                main = "r-largest with r = 4")
Number of events by block
1956 1957 1958 1959 1960 1961 1962 1963 1964 1965 1966 1967 1968 1969 1970 1971
   2    7   11   13   12   13   11   15    6    9   18   22   29   18   17   11
1972 1973 1974 1975 1976 1977 1978 1979 1980 1981 1982 1983 1984 1985 1986 1987
  13   16    9   14   11   15   10   17   14   29   29   29   21   17   17   13
1988 1989 1990 1991 1992 1993 1994 1995 1996 1997 1998 1999 2000 2001 2002 2003
  17    4    5   NA   NA   NA   NA    1    7    8   14   16   19   28   22   17
2004 2005 2006 2007 2008
  24   19   20   31   NA
>
> ## restrict the period
> MAX4 <- OT2MAX(OTdata, OTmissing = OTmissing, MAX.r = 4,
+                start = "1962-01-01",
+                end = "1990-01-01",
+                maxMissingFrac = 0.9,
+                dataFrames = FALSE, trace = TRUE,
+                main = "r-largest with r = 4 with given 'start' and 'end'")
Number of events by block
1962 1963 1964 1965 1966 1967 1968 1969 1970 1971 1972 1973 1974 1975 1976 1977
  11   15    6    9   18   22   29   18   17   11   13   16    9   14   11   15
1978 1979 1980 1981 1982 1983 1984 1985 1986 1987 1988 1989
  10   17   14   29   29   29   21   17   17   13   17    4
> ## Not run:
> ##D   ## use in a block maxima analysis, as if there were no gaps.
> ##D   fit <- fGEV.MAX(MAX.data = MAX3$data,
> ##D                   MAX.effDuration = rep(1, length(MAX3$effDuration)))
> ## End(Not run)
> ## plot the gap rate
> MAX5 <- OT2MAX(OTdata = OTdata, OTmissing = OTmissing,
+                maxMissingFrac = 0.5,
+                main = "probability of being in a  gap",
+                plotType = "gap")
>
> ## time series plot (only <= 10 months)
> plot(MAX5$monthGapTS[ , c(1:4)], main = "gap rate by month")
>
> ## much better with lattice.
> ## Not run:
> ##D     require(lattice)
> ##D     xyplot(MAX5$monthGapTS)
> ## End(Not run)
>
>
>
>
>
> dev.off()
null device
          1
>
 .
.