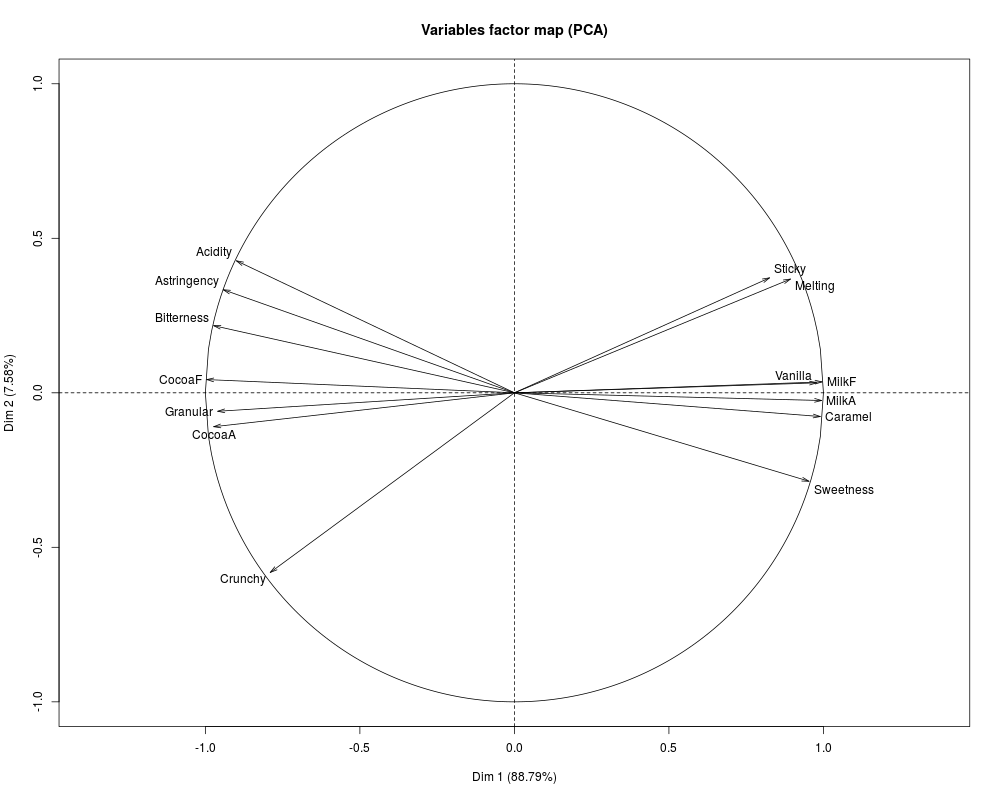
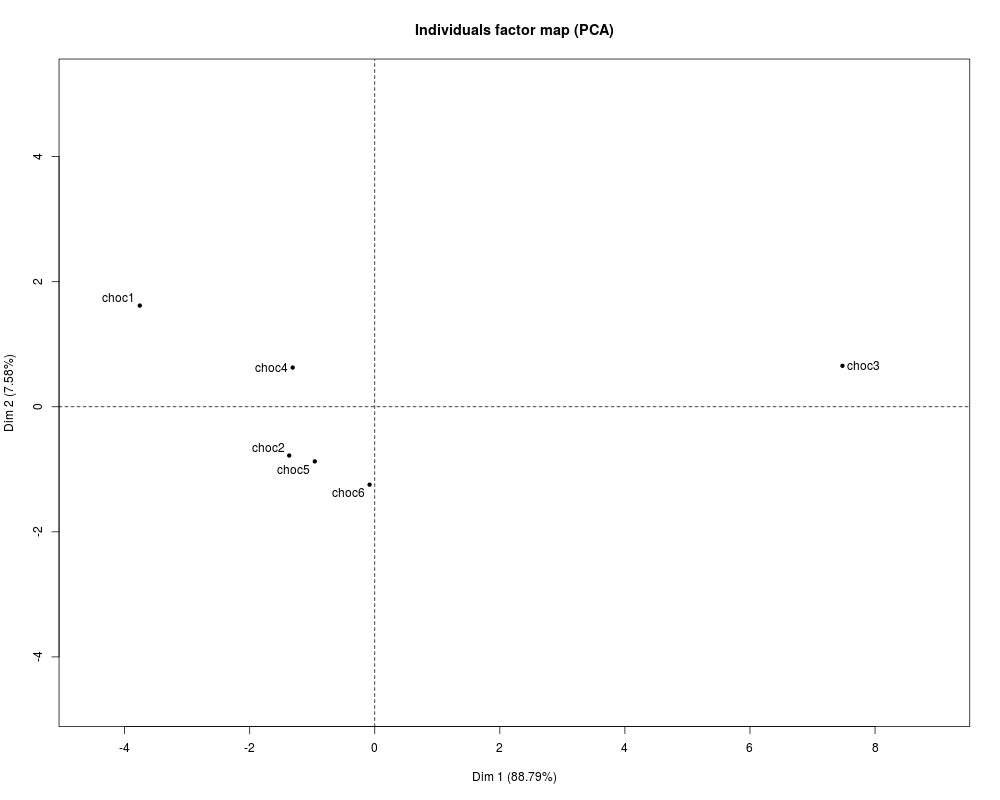
Displays panelists' sensory profiles onto the products' space
Usage
plotpanelist(mat, coord = c(1,2), name = FALSE, eig, cex = 1, color = NULL)
Arguments
mat
a data frame structured as the first element of the list resulting from the function construct.axes,
i.e. the coordinates of the products with respect to the panel and to each panelists
coord
a length 2 vector specifying the components to plot
name
boolean, if T then the name of each panelist is displayed on the graph (by default, FALSE
is assigned to that parameter)
eig
a matrix with the component of the factor analysis (in row) and the eigenvalues, the inertia and the cumulative inertia for each component. Typically, the eig output of the construct.axes function
cex
cf. function par in the graphics package
color
a vector with the colors used; by default there are 35 colors defined
Value
Returns a graph where each product is displayed with respect to a panel and to each panelist composing
the panel. Products described by the panel are displayed as square, they are displayed as circle when
they are described by each panelist.
R version 3.3.1 (2016-06-21) -- "Bug in Your Hair"
Copyright (C) 2016 The R Foundation for Statistical Computing
Platform: x86_64-pc-linux-gnu (64-bit)

R is free software and comes with ABSOLUTELY NO WARRANTY.
You are welcome to redistribute it under certain conditions.
Type 'license()' or 'licence()' for distribution details.

R is a collaborative project with many contributors.
Type 'contributors()' for more information and
'citation()' on how to cite R or R packages in publications.

Type 'demo()' for some demos, 'help()' for on-line help, or
'help.start()' for an HTML browser interface to help.
Type 'q()' to quit R.

> library(SensoMineR)
Loading required package: FactoMineR
> png(filename="/home/ddbj/snapshot/RGM3/R_CC/result/SensoMineR/plotpanelist.Rd_%03d_medium.png", width=480, height=480)
> ### Name: plotpanelist
> ### Title: Plotpanelist
> ### Aliases: plotpanelist
> ### Keywords: multivariate
>
> ### ** Examples
>
> data(chocolates)
> donnee <- cbind.data.frame(sensochoc[,c(1,4,5:18)])
> axe <- construct.axes(donnee, scale.unit = TRUE)
Error in dev.new() : no suitable unused file name for pdf()
Calls: construct.axes -> dev.new
Execution halted
 .
.