Supported by Dr. Osamu Ogasawara and  . . |
|
Last data update: 2014.03.03 |
Fit a piecewise linear modelDescriptionFit a degree 1 spline with 1 knot point where the location of the knot point is unknown. Usagepiecewise.linear(x, y, middle = 1, CI = FALSE, bootstrap.samples = 1000, sig.level = 0.05) Arguments
DetailsThe bootstrap samples are taken by resampling the raw data points. Often a more appropriate bootstrap sample would be to calculate the residuals and then add a randomly selected residual to each y-value. ValueA list of 5 elements is returned:
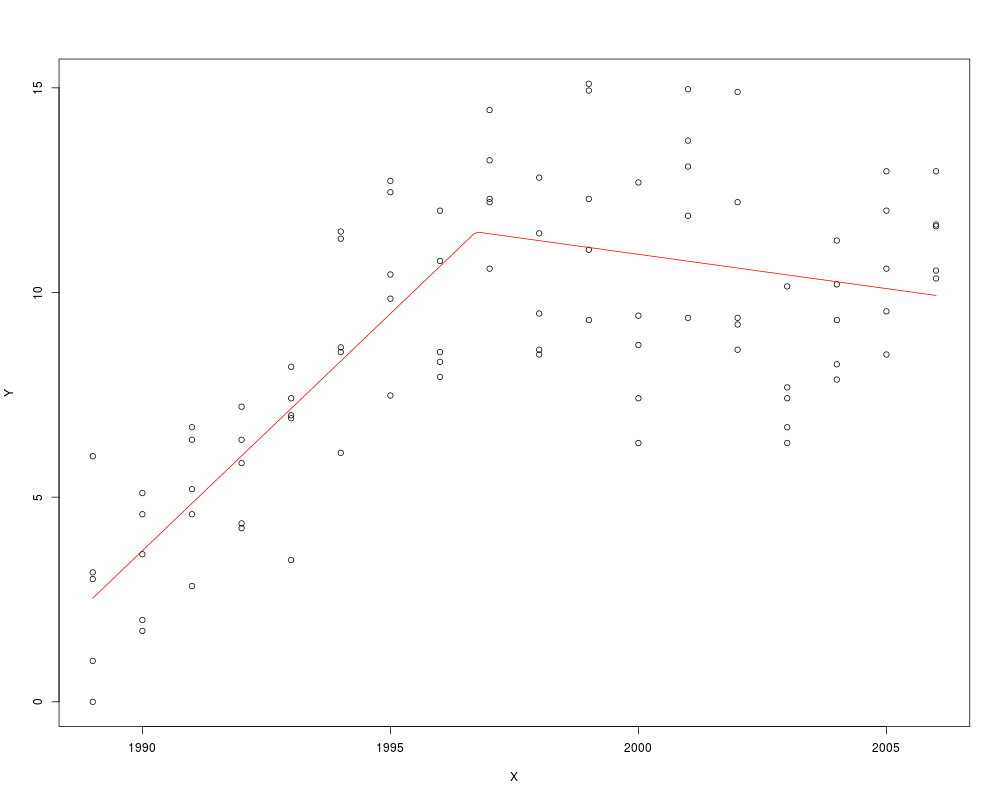
... Author(s)Derek Sonderegger ReferencesChiu, G. S., R. Lockhart, and R. Routledge. 2006. Bent-cable regression theory and applications. Journal of the American Statistical Association 101:542-553. Toms, J. D., and M. L. Lesperance. 2003. Piecewise regression: a tool for identifying ecological thresholds. Ecology 84:2034-2041. See Also ~~objects to See Also as Examplesdata(Arkansas) x <- Arkansas$year y <- Arkansas$sqrt.mayflies model <- piecewise.linear(x,y, CI=FALSE) plot(model) print(model) predict(model, 2001) Results
R version 3.3.1 (2016-06-21) -- "Bug in Your Hair"
Copyright (C) 2016 The R Foundation for Statistical Computing
Platform: x86_64-pc-linux-gnu (64-bit)

R is free software and comes with ABSOLUTELY NO WARRANTY.
You are welcome to redistribute it under certain conditions.
Type 'license()' or 'licence()' for distribution details.

R is a collaborative project with many contributors.
Type 'contributors()' for more information and
'citation()' on how to cite R or R packages in publications.

Type 'demo()' for some demos, 'help()' for on-line help, or
'help.start()' for an HTML browser interface to help.
Type 'q()' to quit R.

> library(SiZer)
Loading required package: splines
Loading required package: boot
> png(filename="/home/ddbj/snapshot/RGM3/R_CC/result/SiZer/piecewise.linear.Rd_%03d_medium.png", width=480, height=480)
> ### Name: piecewise.linear
> ### Title: Fit a piecewise linear model
> ### Aliases: piecewise.linear piecewise.linear.simple
> ###   logLik.PiecewiseLinear predict.PiecewiseLinear plot.PiecewiseLinear
> ###   print.PiecewiseLinear piecewise.linear.likelihood
> ### Keywords: regression
>
> ### ** Examples
>
> data(Arkansas)
> x <- Arkansas$year
> y <- Arkansas$sqrt.mayflies
>
> model <- piecewise.linear(x,y, CI=FALSE)
> plot(model)
> print(model)
[1] "Threshold alpha: 1996.72364605122"
[1] ""
[1] "Model coefficients: Beta[0], Beta[1], Beta[2]"
 (Intercept)            x            w
-2301.334060     1.158305    -1.325665
> predict(model, 2001)
(Intercept)
   10.76505
>
>
>
>
>
> dev.off()
null device
          1
>
|