Supported by Dr. Osamu Ogasawara and  . . |
|
Last data update: 2014.03.03 |
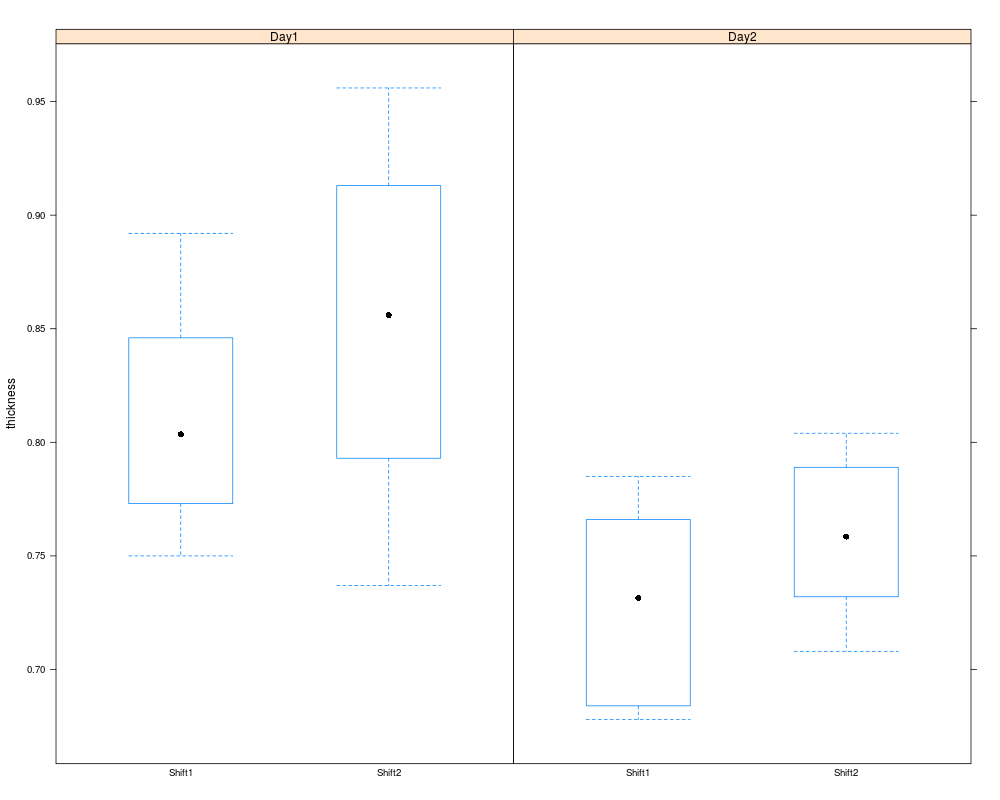
Metal Plates ThicknessDescriptionThis data set contains the thickness and additional data for 24 metal plates. Usage
data("ss.data.thickness")
FormatA data frame with 24 observations on the following 5 variables.
DetailsThis data set illustrates concepts in the book “Quality Control with R”.
Note that, in the book, the data set is named SourceTable 5.1 in the reference below. ReferencesCano, E.L. and Moguerza, J.M. and Prieto Corcoba, M. (2015) Quality Control with R. An ISO Standards Approach. Springer. Examples
data(ss.data.thickness)
str(ss.data.thickness)
lattice::bwplot(thickness ~ shift | day,
    data = ss.data.thickness)
Results
R version 3.3.1 (2016-06-21) -- "Bug in Your Hair"
Copyright (C) 2016 The R Foundation for Statistical Computing
Platform: x86_64-pc-linux-gnu (64-bit)

R is free software and comes with ABSOLUTELY NO WARRANTY.
You are welcome to redistribute it under certain conditions.
Type 'license()' or 'licence()' for distribution details.

R is a collaborative project with many contributors.
Type 'contributors()' for more information and
'citation()' on how to cite R or R packages in publications.

Type 'demo()' for some demos, 'help()' for on-line help, or
'help.start()' for an HTML browser interface to help.
Type 'q()' to quit R.

> library(SixSigma)
> png(filename="/home/ddbj/snapshot/RGM3/R_CC/result/SixSigma/ss.data.thickness.Rd_%03d_medium.png", width=480, height=480)
> ### Name: ss.data.thickness
> ### Title: Metal Plates Thickness
> ### Aliases: ss.data.thickness
> ### Keywords: datasets
>
> ### ** Examples
>
>
> data(ss.data.thickness)
> str(ss.data.thickness)
'data.frame':	24 obs. of  5 variables:
 $ thickness: num  0.821 0.846 0.892 0.75 0.773 0.786 0.956 0.84 0.913 0.737 ...
 $ day      : Factor w/ 2 levels "Day1","Day2": 1 1 1 1 1 1 1 1 1 1 ...
 $ shift    : Factor w/ 2 levels "Shift1","Shift2": 1 1 1 1 1 1 2 2 2 2 ...
 $ dayshift : Factor w/ 4 levels "Day1.Shift1",..: 1 1 1 1 1 1 2 2 2 2 ...
 $ position : Factor w/ 2 levels "bellow","above": 2 2 2 1 2 2 2 2 2 1 ...
> lattice::bwplot(thickness ~ shift | day,
+     data = ss.data.thickness)
>
>
>
>
>
>
> dev.off()
null device
          1
>
|
Created & Maintained by Osamu Ogasawara (osamu.ogasawara@gmail.com) and 