A logical argument: If log.it=T, then probe data is log2
transformed.
rna.deg.obj
Output from AffyRNAdeg.
signif.digits
Number of significant digits to show.
transform
Possible choices are "shift.scale","shift.only", and
"neither". "Shift" vertically staggers the plots for individual chips,
to make the display easier to read. "Scale" normalizes so that standard
deviation is equal to 1.
cols
A vector of colors for plot, length = number of chips.
...
further arguments for plot function.
Details
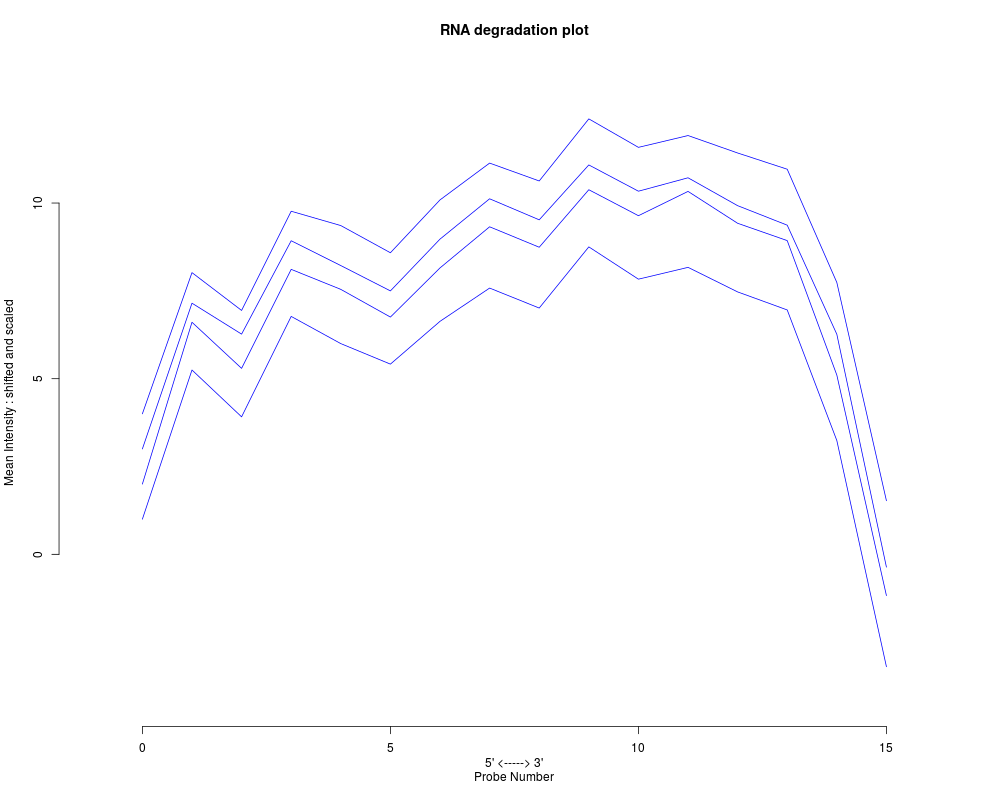
Within each probeset, probes are numbered directionally from
the 5' end to the 3' end. Probe intensities are averaged by probe
number, across all genes. If log.it=FALSE and transform="Neither",
then plotAffyRNAdeg simply shows these means for each chip. Shifted and
scaled versions of the plot can make it easier to see.
Value
AffyRNAdeg returns a list with the following components:
sample.names
names of samples, derived from affy batch object
means.by.number
average intensity by probe position
ses
standard errors for probe position averages
slope
from linear regression of means.by.number
pvalue
from linear regression of means.by.number
Author(s)
Leslie Cope
Examples
if (require(affydata)) {
  data(Dilution)
  RNAdeg<-AffyRNAdeg(Dilution)
  plotAffyRNAdeg(RNAdeg)
}
Results
R version 3.3.1 (2016-06-21) -- "Bug in Your Hair"
Copyright (C) 2016 The R Foundation for Statistical Computing
Platform: x86_64-pc-linux-gnu (64-bit)

R is free software and comes with ABSOLUTELY NO WARRANTY.
You are welcome to redistribute it under certain conditions.
Type 'license()' or 'licence()' for distribution details.

R is a collaborative project with many contributors.
Type 'contributors()' for more information and
'citation()' on how to cite R or R packages in publications.

Type 'demo()' for some demos, 'help()' for on-line help, or
'help.start()' for an HTML browser interface to help.
Type 'q()' to quit R.

> library(affy)
Loading required package: BiocGenerics
Loading required package: parallel

Attaching package: 'BiocGenerics'

The following objects are masked from 'package:parallel':

    clusterApply, clusterApplyLB, clusterCall, clusterEvalQ,
    clusterExport, clusterMap, parApply, parCapply, parLapply,
    parLapplyLB, parRapply, parSapply, parSapplyLB

The following objects are masked from 'package:stats':

    IQR, mad, xtabs

The following objects are masked from 'package:base':

    Filter, Find, Map, Position, Reduce, anyDuplicated, append,
    as.data.frame, cbind, colnames, do.call, duplicated, eval, evalq,
    get, grep, grepl, intersect, is.unsorted, lapply, lengths, mapply,
    match, mget, order, paste, pmax, pmax.int, pmin, pmin.int, rank,
    rbind, rownames, sapply, setdiff, sort, table, tapply, union,
    unique, unsplit

Loading required package: Biobase
Welcome to Bioconductor

    Vignettes contain introductory material; view with
    'browseVignettes()'. To cite Bioconductor, see
    'citation("Biobase")', and for packages 'citation("pkgname")'.

> png(filename="/home/ddbj/snapshot/RGM3/R_BC/result/affy/AffyRNAdeg.Rd_%03d_medium.png", width=480, height=480)
> ### Name: AffyRNAdeg
> ### Title: Function to assess RNA degradation in Affymetrix GeneChip data.
> ### Aliases: AffyRNAdeg summaryAffyRNAdeg plotAffyRNAdeg
> ### Keywords: hplot manip
>
> ### ** Examples
>
> if (require(affydata)) {
+   data(Dilution)
+   RNAdeg<-AffyRNAdeg(Dilution)
+   plotAffyRNAdeg(RNAdeg)
+ }
Loading required package: affydata
     Package    LibPath                            Item
[1,] "affydata" "/home/ddbj/local/lib64/R/library" "Dilution"
     Title
[1,] "AffyBatch instance Dilution"

Warning messages:
1: replacing previous import 'AnnotationDbi::tail' by 'utils::tail' when loading 'hgu95av2cdf'
2: replacing previous import 'AnnotationDbi::head' by 'utils::head' when loading 'hgu95av2cdf'
>
>
>
>
>
> dev.off()
null device
          1
>
 .
.