a set of indices to use when drawing the loess curve.
show.statistics
logical. If TRUE, some summary statistics of the M
values are drawn.
span
span to be used for loess fit.
family.loess
"guassian" or "symmetric" as in
loess.
cex
size of text when writing summary statistics on plot.
plot.method
a string specifying how the plot is to be drawn.
"normal" plots points, "smoothScatter" uses the
smoothScatter function. Specifying
"add" means that the MAplot should be added to the current plot.
add.loess
add a loess line to the plot.
lwd
width of loess line.
lty
line type for loess line.
loess.col
color for loess line.
See Also
mva.pairs
Examples
if (require(affydata)) {
data(Dilution)
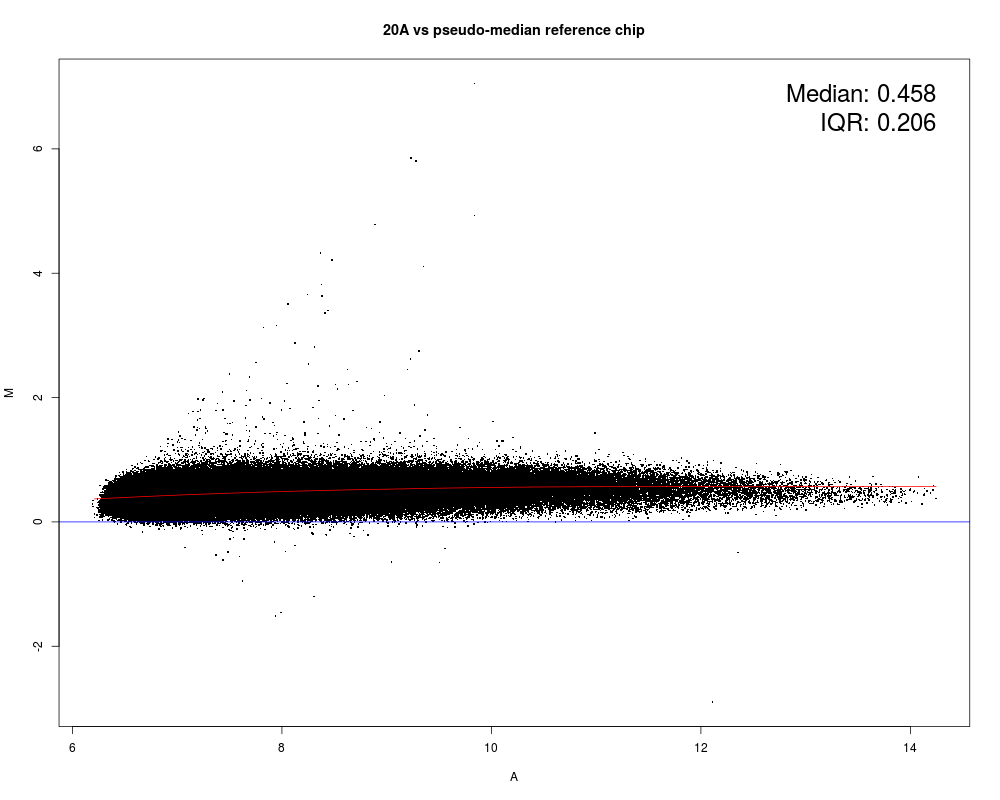
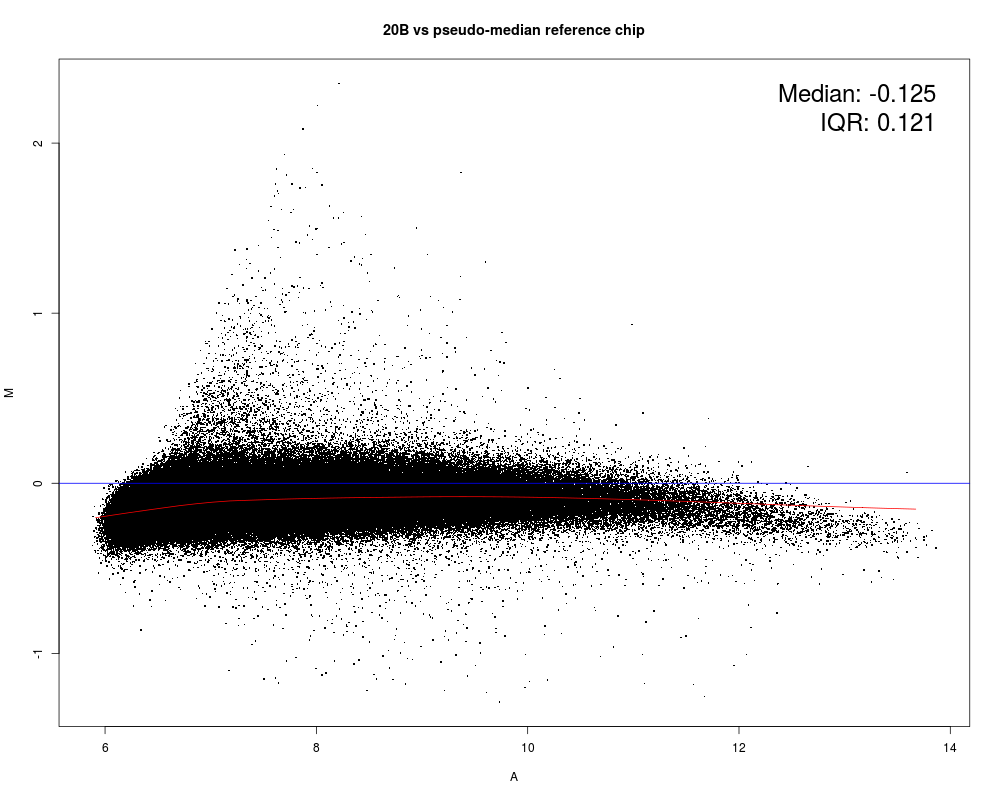
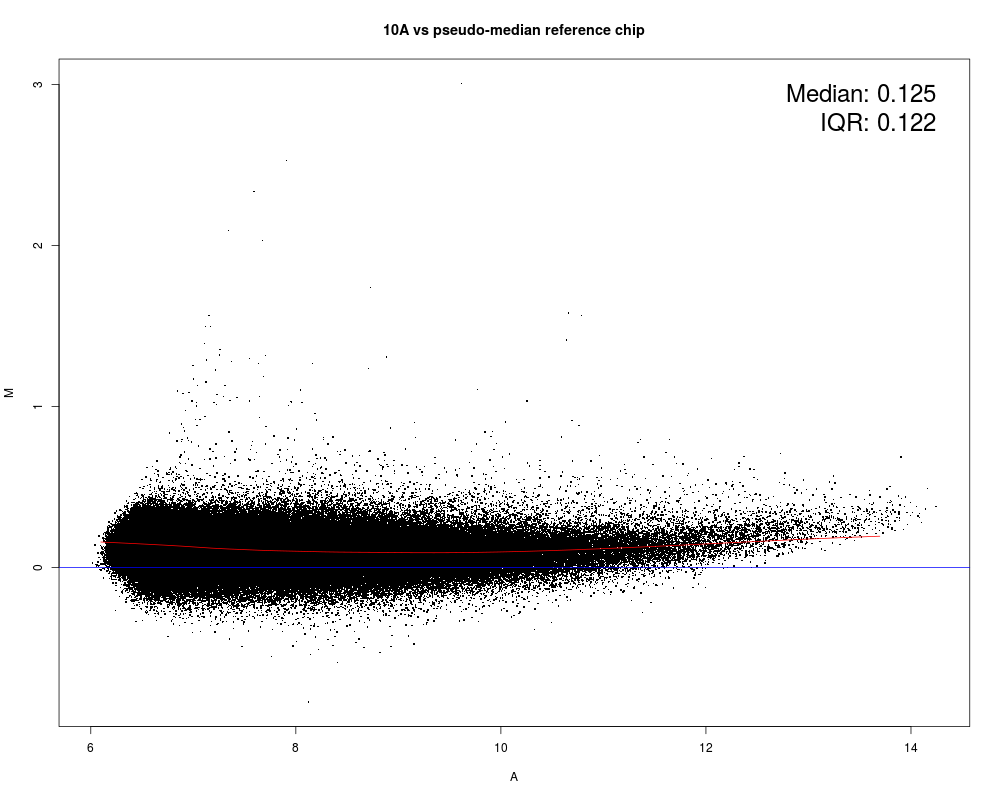
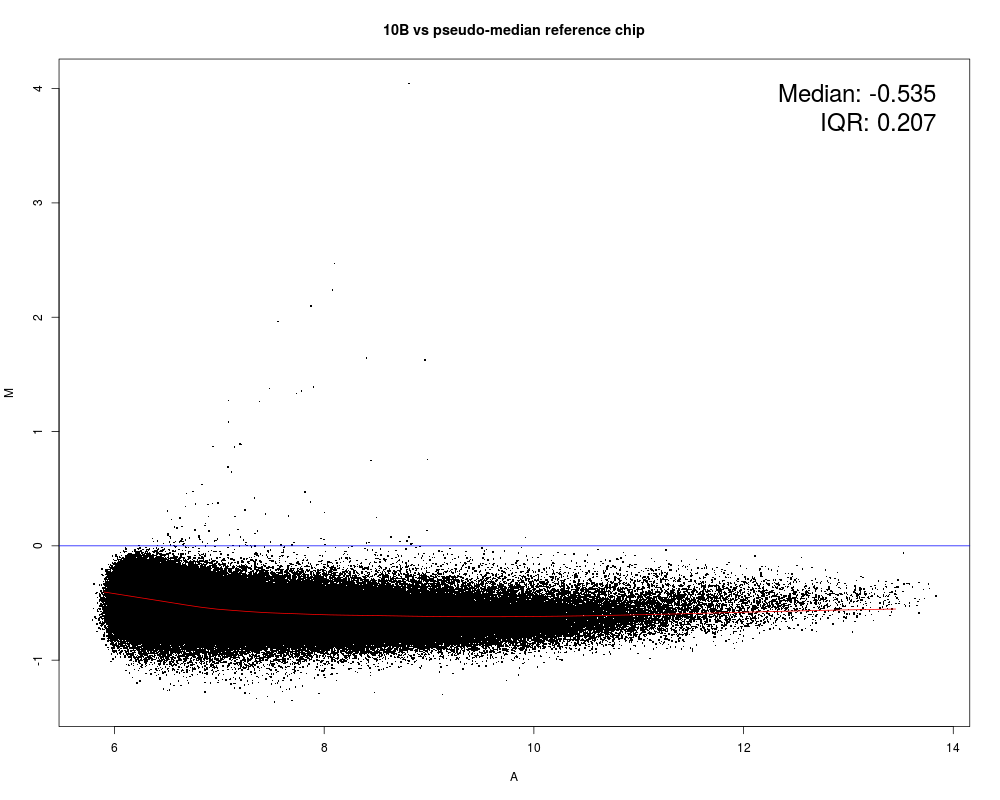
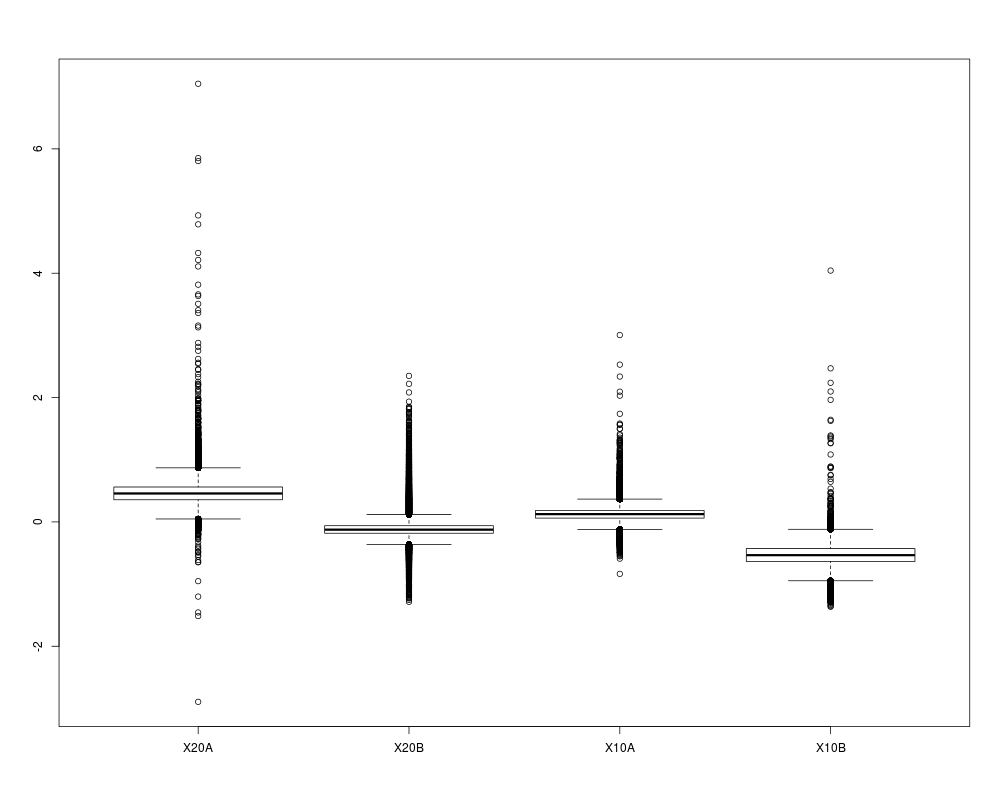
MAplot(Dilution)
Mbox(Dilution)
}
Results
R version 3.3.1 (2016-06-21) -- "Bug in Your Hair"
Copyright (C) 2016 The R Foundation for Statistical Computing
Platform: x86_64-pc-linux-gnu (64-bit)

R is free software and comes with ABSOLUTELY NO WARRANTY.
You are welcome to redistribute it under certain conditions.
Type 'license()' or 'licence()' for distribution details.

R is a collaborative project with many contributors.
Type 'contributors()' for more information and
'citation()' on how to cite R or R packages in publications.

Type 'demo()' for some demos, 'help()' for on-line help, or
'help.start()' for an HTML browser interface to help.
Type 'q()' to quit R.

> library(affy)
Loading required package: BiocGenerics
Loading required package: parallel

Attaching package: 'BiocGenerics'

The following objects are masked from 'package:parallel':

    clusterApply, clusterApplyLB, clusterCall, clusterEvalQ,
    clusterExport, clusterMap, parApply, parCapply, parLapply,
    parLapplyLB, parRapply, parSapply, parSapplyLB

The following objects are masked from 'package:stats':

    IQR, mad, xtabs

The following objects are masked from 'package:base':

    Filter, Find, Map, Position, Reduce, anyDuplicated, append,
    as.data.frame, cbind, colnames, do.call, duplicated, eval, evalq,
    get, grep, grepl, intersect, is.unsorted, lapply, lengths, mapply,
    match, mget, order, paste, pmax, pmax.int, pmin, pmin.int, rank,
    rbind, rownames, sapply, setdiff, sort, table, tapply, union,
    unique, unsplit

Loading required package: Biobase
Welcome to Bioconductor

    Vignettes contain introductory material; view with
    'browseVignettes()'. To cite Bioconductor, see
    'citation("Biobase")', and for packages 'citation("pkgname")'.

> png(filename="/home/ddbj/snapshot/RGM3/R_BC/result/affy/MAplot.Rd_%03d_medium.png", width=480, height=480)
> ### Name: MAplot
> ### Title: Relative M vs. A plots
> ### Aliases: ma.plot Mbox MAplot Mbox,AffyBatch-method
> ###   MAplot,AffyBatch-method
> ### Keywords: hplot
>
> ### ** Examples
>
> if (require(affydata)) {
+    data(Dilution)
+    MAplot(Dilution)
+    Mbox(Dilution)
+ }
Loading required package: affydata
     Package    LibPath                            Item
[1,] "affydata" "/home/ddbj/local/lib64/R/library" "Dilution"
     Title
[1,] "AffyBatch instance Dilution"

Warning messages:
1: replacing previous import 'AnnotationDbi::tail' by 'utils::tail' when loading 'hgu95av2cdf'
2: replacing previous import 'AnnotationDbi::head' by 'utils::head' when loading 'hgu95av2cdf'
>
>
>
>
>
> dev.off()
null device
          1
>
 .
.