Supported by Dr. Osamu Ogasawara and  . . |
|
Last data update: 2014.03.03 |
Elisa assay of DNaseDescriptionThe UsageDNase FormatAn object of class
DetailsThis dataset was originally part of package SourceDavidian, M. and Giltinan, D. M. (1995) Nonlinear Models for Repeated Measurement Data, Chapman & Hall (section 5.2.4, p. 134) Pinheiro, J. C. and Bates, D. M. (2000) Mixed-effects Models in S and S-PLUS, Springer. Examples
require(stats); require(graphics)
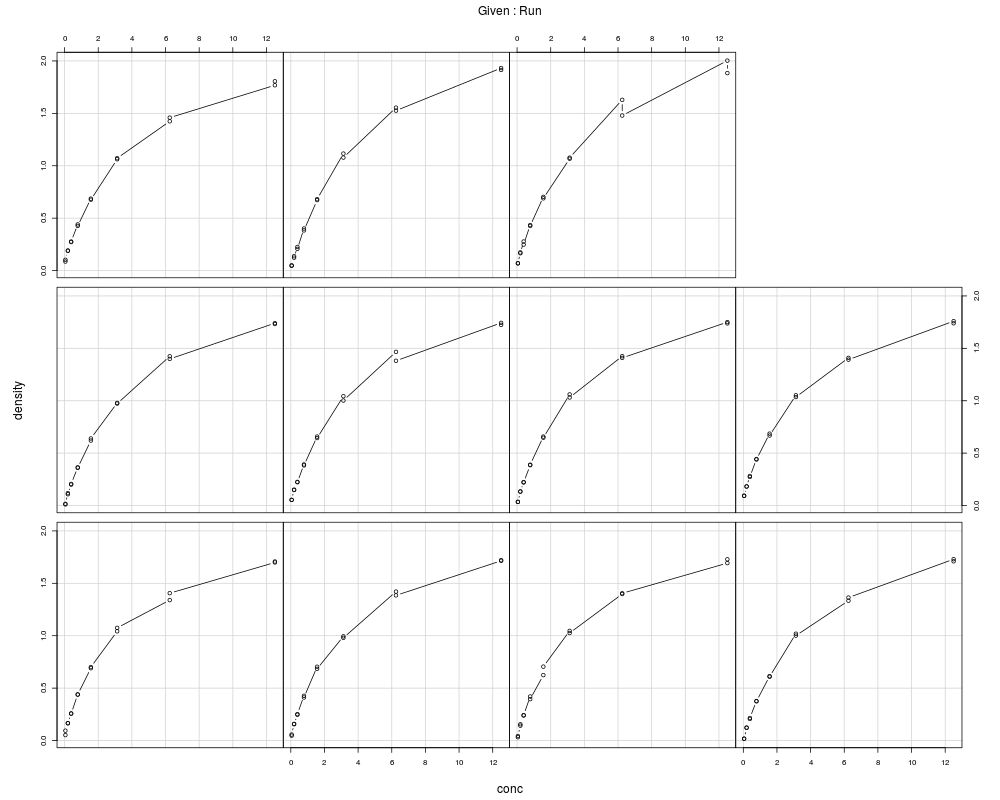
coplot(density ~ conc | Run, data = DNase,
show.given = FALSE, type = "b")
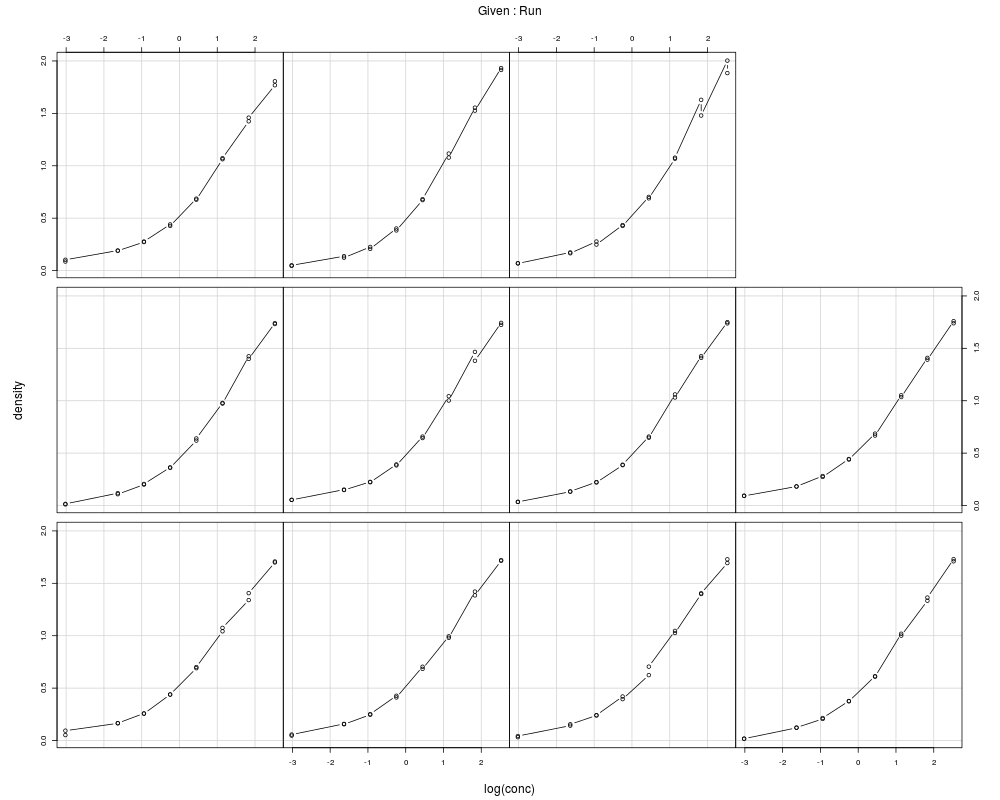
coplot(density ~ log(conc) | Run, data = DNase,
show.given = FALSE, type = "b")
## fit a representative run
fm1 <- nls(density ~ SSlogis( log(conc), Asym, xmid, scal ),
data = DNase, subset = Run == 1)
## compare with a four-parameter logistic
fm2 <- nls(density ~ SSfpl( log(conc), A, B, xmid, scal ),
data = DNase, subset = Run == 1)
summary(fm2)
anova(fm1, fm2)
Results
R version 3.3.1 (2016-06-21) -- "Bug in Your Hair"
Copyright (C) 2016 The R Foundation for Statistical Computing
Platform: x86_64-pc-linux-gnu (64-bit)

R is free software and comes with ABSOLUTELY NO WARRANTY.
You are welcome to redistribute it under certain conditions.
Type 'license()' or 'licence()' for distribution details.

R is a collaborative project with many contributors.
Type 'contributors()' for more information and
'citation()' on how to cite R or R packages in publications.

Type 'demo()' for some demos, 'help()' for on-line help, or
'help.start()' for an HTML browser interface to help.
Type 'q()' to quit R.

> library(datasets)
> png(filename="/home/ddbj/snapshot/RGM3/R_rel/result/datasets/DNase.Rd_%03d_medium.png", width=480, height=480)
> ### Name: DNase
> ### Title: Elisa assay of DNase
> ### Aliases: DNase
> ### Keywords: datasets
>
> ### ** Examples
>
> require(stats); require(graphics)
> ## Don't show:
> options(show.nls.convergence=FALSE)
> ## End(Don't show)
> coplot(density ~ conc | Run, data = DNase,
+        show.given = FALSE, type = "b")
> coplot(density ~ log(conc) | Run, data = DNase,
+        show.given = FALSE, type = "b")
> ## fit a representative run
> fm1 <- nls(density ~ SSlogis( log(conc), Asym, xmid, scal ),
+     data = DNase, subset = Run == 1)
> ## compare with a four-parameter logistic
> fm2 <- nls(density ~ SSfpl( log(conc), A, B, xmid, scal ),
+     data = DNase, subset = Run == 1)
> summary(fm2)

Formula: density ~ SSfpl(log(conc), A, B, xmid, scal)

Parameters:
      Estimate Std. Error t value Pr(>|t|)
A    -0.007897   0.017200  -0.459    0.654
B     2.377239   0.109516  21.707 5.35e-11 ***
xmid  1.507403   0.102080  14.767 4.65e-09 ***
scal  1.062579   0.056996  18.643 3.16e-10 ***
---
Signif. codes:  0 '***' 0.001 '**' 0.01 '*' 0.05 '.' 0.1 ' ' 1

Residual standard error: 0.01981 on 12 degrees of freedom

> anova(fm1, fm2)
Analysis of Variance Table

Model 1: density ~ SSlogis(log(conc), Asym, xmid, scal)
Model 2: density ~ SSfpl(log(conc), A, B, xmid, scal)
  Res.Df Res.Sum Sq Df     Sum Sq F value Pr(>F)
1     13  0.0047896
2     12  0.0047073  1 8.2314e-05  0.2098 0.6551
>
>
>
>
>
> dev.off()
null device
          1
>
|