Supported by Dr. Osamu Ogasawara and  . . |
|
Last data update: 2014.03.03 |
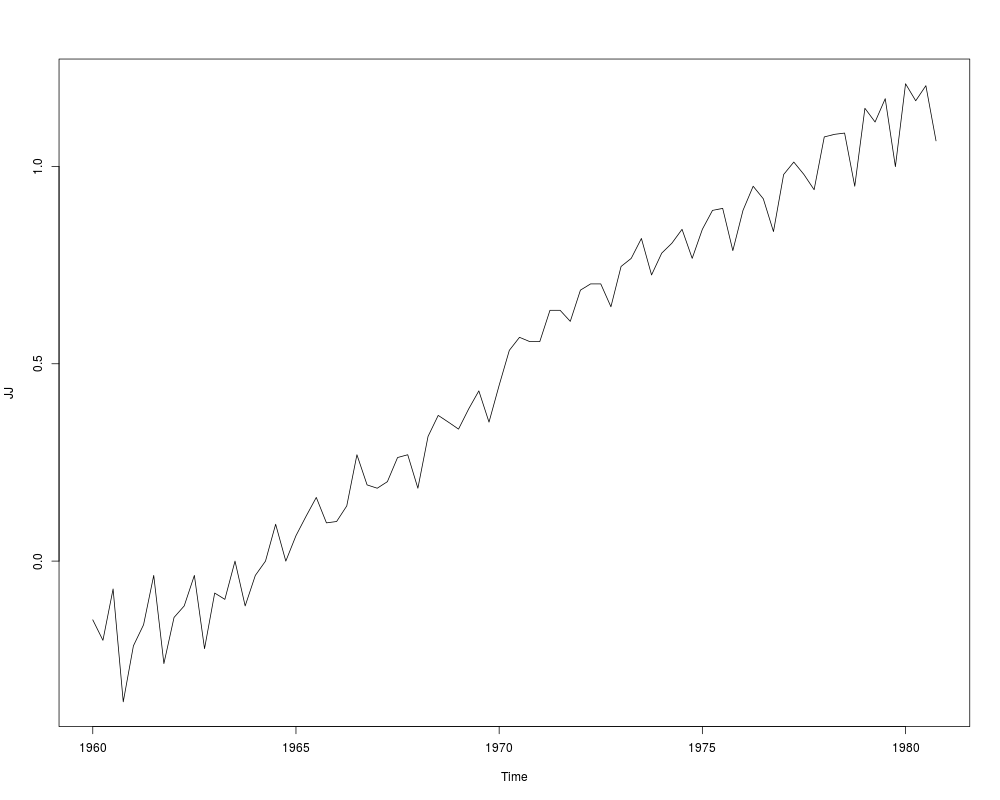
Quarterly Earnings per Johnson & Johnson ShareDescriptionQuarterly earnings (dollars) per Johnson & Johnson share 1960–80. UsageJohnsonJohnson FormatA quarterly time series SourceShumway, R. H. and Stoffer, D. S. (2000) Time Series Analysis and its Applications. Second Edition. Springer. Example 1.1. Examples
require(stats); require(graphics)
JJ <- log10(JohnsonJohnson)
plot(JJ)
## This example gives a possible-non-convergence warning on some
## platforms, but does seem to converge on x86 Linux and Windows.
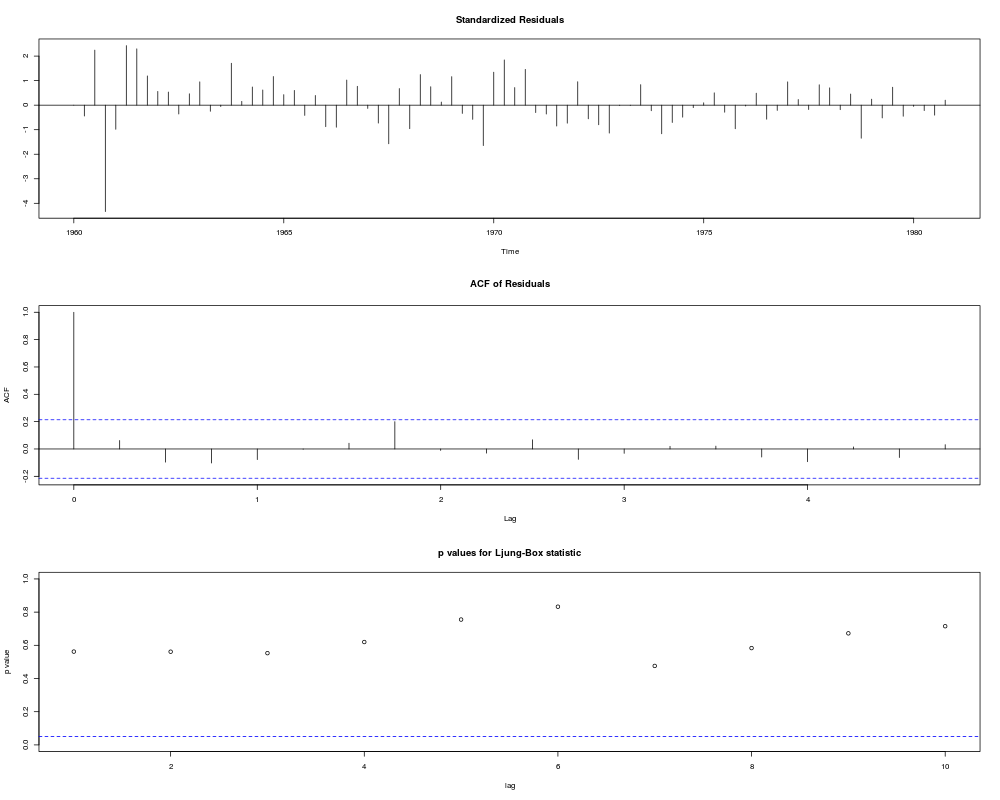
(fit <- StructTS(JJ, type = "BSM"))
tsdiag(fit)
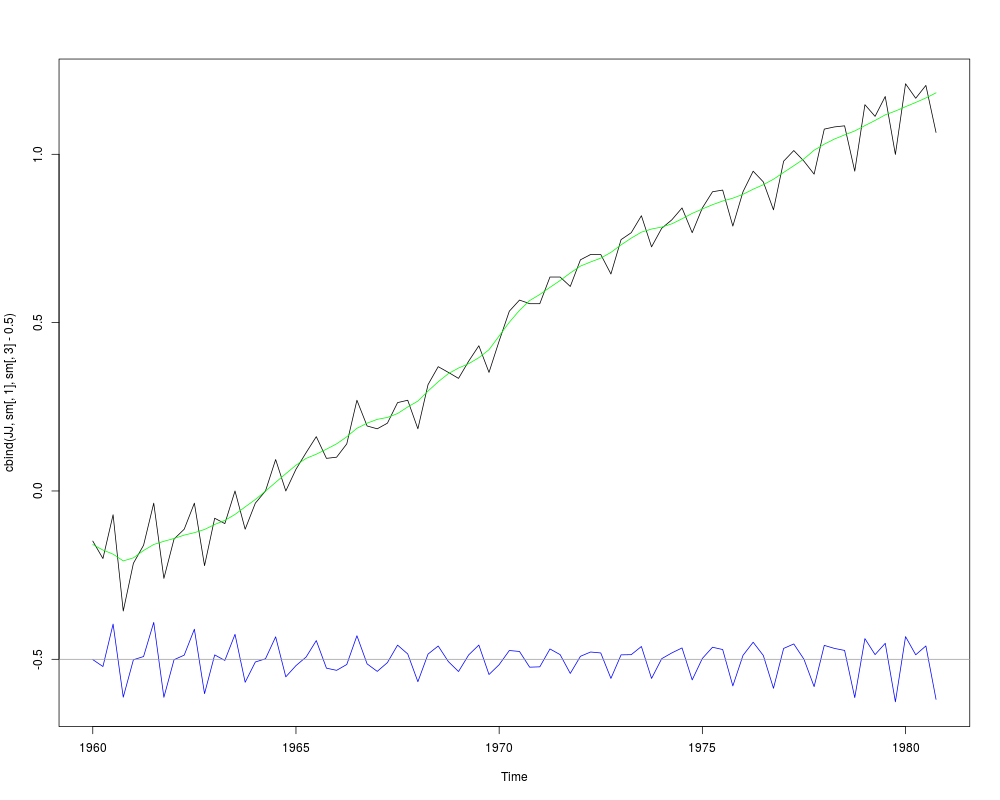
sm <- tsSmooth(fit)
plot(cbind(JJ, sm[, 1], sm[, 3]-0.5), plot.type = "single",
col = c("black", "green", "blue"))
abline(h = -0.5, col = "grey60")
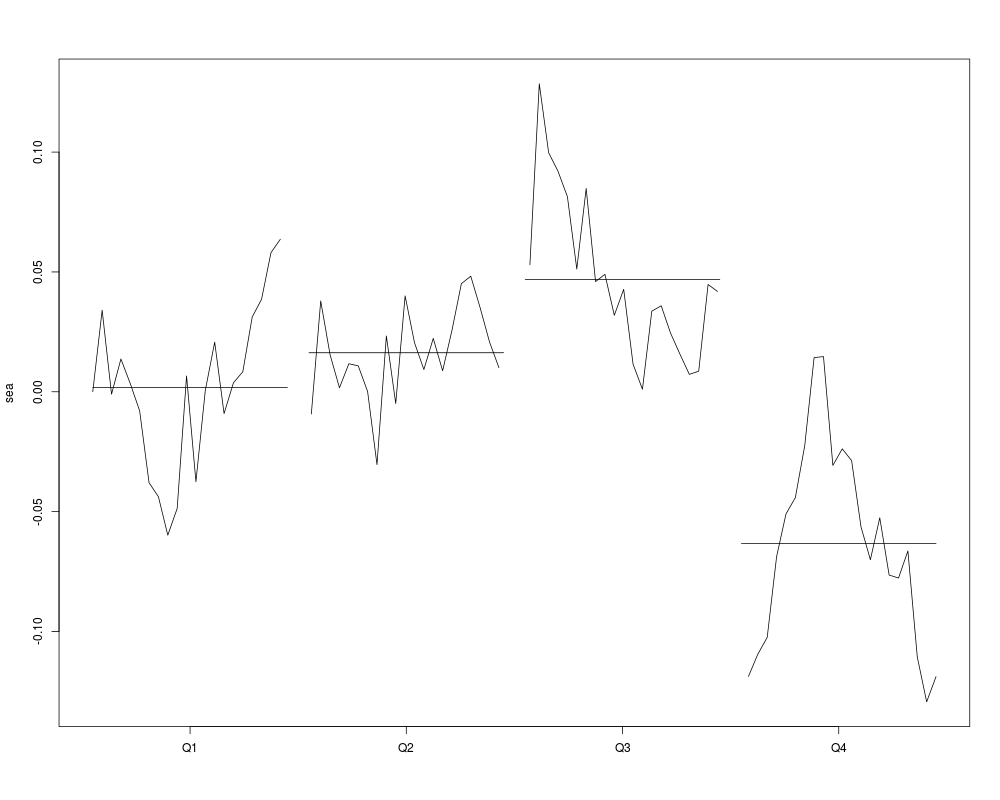
monthplot(fit)
Results
R version 3.3.1 (2016-06-21) -- "Bug in Your Hair"
Copyright (C) 2016 The R Foundation for Statistical Computing
Platform: x86_64-pc-linux-gnu (64-bit)

R is free software and comes with ABSOLUTELY NO WARRANTY.
You are welcome to redistribute it under certain conditions.
Type 'license()' or 'licence()' for distribution details.

R is a collaborative project with many contributors.
Type 'contributors()' for more information and
'citation()' on how to cite R or R packages in publications.

Type 'demo()' for some demos, 'help()' for on-line help, or
'help.start()' for an HTML browser interface to help.
Type 'q()' to quit R.

> library(datasets)
> png(filename="/home/ddbj/snapshot/RGM3/R_rel/result/datasets/JohnsonJohnson.Rd_%03d_medium.png", width=480, height=480)
> ### Name: JohnsonJohnson
> ### Title: Quarterly Earnings per Johnson & Johnson Share
> ### Aliases: JohnsonJohnson
> ### Keywords: datasets
>
> ### ** Examples
> ## No test:
> require(stats); require(graphics)
> JJ <- log10(JohnsonJohnson)
> plot(JJ)
> ## This example gives a possible-non-convergence warning on some
> ## platforms, but does seem to converge on x86 Linux and Windows.
> (fit <- StructTS(JJ, type = "BSM"))

Call:
StructTS(x = JJ, type = "BSM")

Variances:
    level      slope       seas    epsilon
1.948e-04  6.548e-06  4.138e-04  2.647e-04
> tsdiag(fit)
> sm <- tsSmooth(fit)
> plot(cbind(JJ, sm[, 1], sm[, 3]-0.5), plot.type = "single",
+      col = c("black", "green", "blue"))
> abline(h = -0.5, col = "grey60")
>
> monthplot(fit)
> ## End(No test)
>
>
>
>
> dev.off()
null device
          1
>
|
Created & Maintained by Osamu Ogasawara (osamu.ogasawara@gmail.com) and 