Supported by Dr. Osamu Ogasawara and  . . |
|
Last data update: 2014.03.03 |
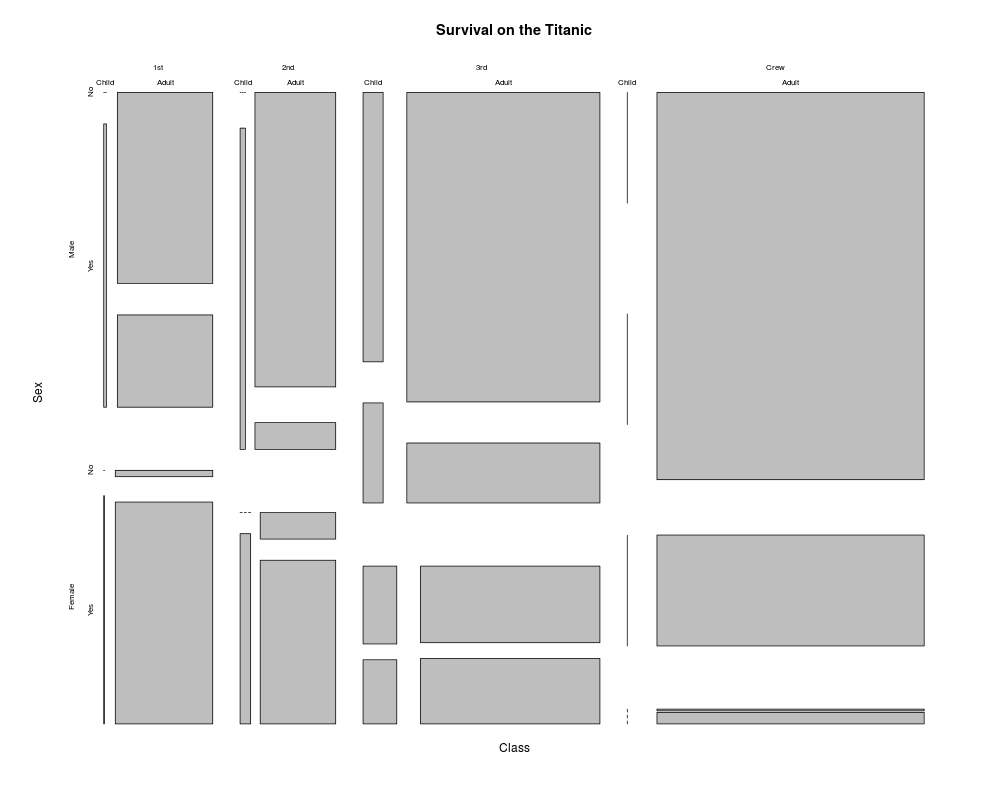
Survival of passengers on the TitanicDescriptionThis data set provides information on the fate of passengers on the fatal maiden voyage of the ocean liner ‘Titanic’, summarized according to economic status (class), sex, age and survival. UsageTitanic FormatA 4-dimensional array resulting from cross-tabulating 2201 observations on 4 variables. The variables and their levels are as follows:
DetailsThe sinking of the Titanic is a famous event, and new books are still being published about it. Many well-known facts—from the proportions of first-class passengers to the ‘women and children first’ policy, and the fact that that policy was not entirely successful in saving the women and children in the third class—are reflected in the survival rates for various classes of passenger. These data were originally collected by the British Board of Trade in their investigation of the sinking. Note that there is not complete agreement among primary sources as to the exact numbers on board, rescued, or lost. Due in particular to the very successful film ‘Titanic’, the last years saw a rise in public interest in the Titanic. Very detailed data about the passengers is now available on the Internet, at sites such as Encyclopedia Titanica (http://www.rmplc.co.uk/eduweb/sites/phind). SourceDawson, Robert J. MacG. (1995), The ‘Unusual Episode’ Data Revisited. Journal of Statistics Education, 3. https://www.amstat.org/publications/jse/v3n3/datasets.dawson.html The source provides a data set recording class, sex, age, and survival status for each person on board of the Titanic, and is based on data originally collected by the British Board of Trade and reprinted in: British Board of Trade (1990), Report on the Loss of the ‘Titanic’ (S.S.). British Board of Trade Inquiry Report (reprint). Gloucester, UK: Allan Sutton Publishing. Examplesrequire(graphics) mosaicplot(Titanic, main = "Survival on the Titanic") ## Higher survival rates in children? apply(Titanic, c(3, 4), sum) ## Higher survival rates in females? apply(Titanic, c(2, 4), sum) ## Use loglm() in package 'MASS' for further analysis ... Results
R version 3.3.1 (2016-06-21) -- "Bug in Your Hair"
Copyright (C) 2016 The R Foundation for Statistical Computing
Platform: x86_64-pc-linux-gnu (64-bit)

R is free software and comes with ABSOLUTELY NO WARRANTY.
You are welcome to redistribute it under certain conditions.
Type 'license()' or 'licence()' for distribution details.

R is a collaborative project with many contributors.
Type 'contributors()' for more information and
'citation()' on how to cite R or R packages in publications.

Type 'demo()' for some demos, 'help()' for on-line help, or
'help.start()' for an HTML browser interface to help.
Type 'q()' to quit R.

> library(datasets)
> png(filename="/home/ddbj/snapshot/RGM3/R_rel/result/datasets/Titanic.Rd_%03d_medium.png", width=480, height=480)
> ### Name: Titanic
> ### Title: Survival of passengers on the Titanic
> ### Aliases: Titanic
> ### Keywords: datasets
>
> ### ** Examples
>
> require(graphics)
> mosaicplot(Titanic, main = "Survival on the Titanic")
> ## Higher survival rates in children?
> apply(Titanic, c(3, 4), sum)
       Survived
Age       No Yes
  Child   52  57
  Adult 1438 654
> ## Higher survival rates in females?
> apply(Titanic, c(2, 4), sum)
        Survived
Sex        No Yes
  Male   1364 367
  Female  126 344
> ## Use loglm() in package 'MASS' for further analysis ...
>
>
>
>
>
> dev.off()
null device
          1
>
|