Supported by Dr. Osamu Ogasawara and  . . |
|
Last data update: 2014.03.03 |
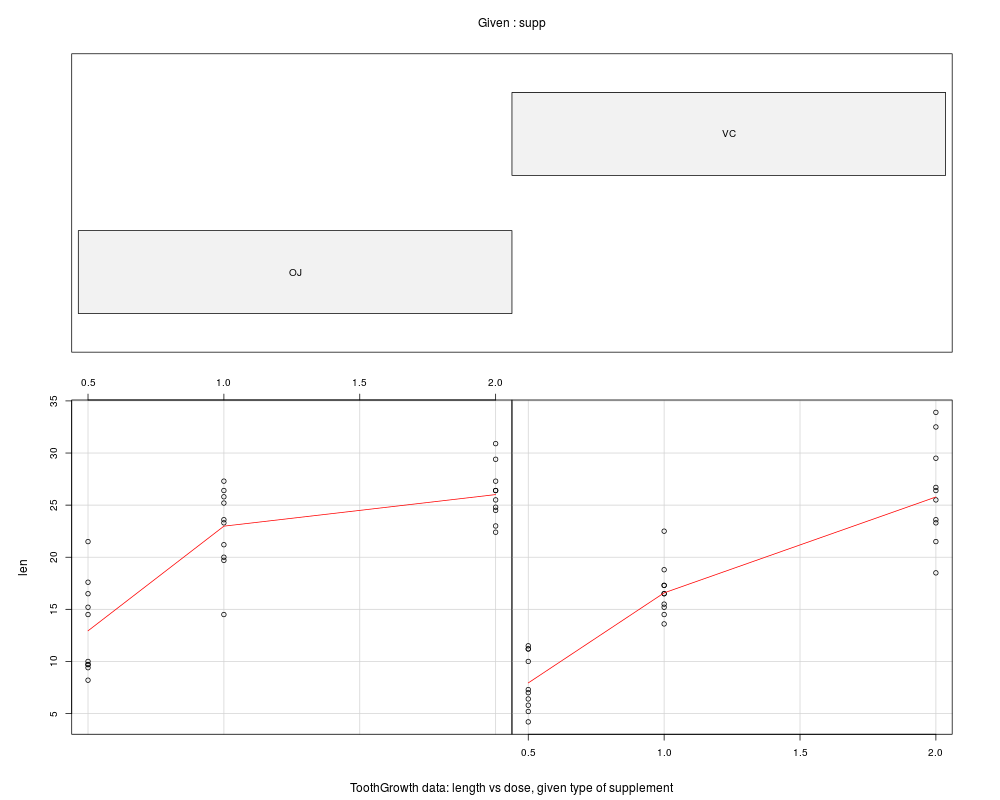
The Effect of Vitamin C on Tooth Growth in Guinea PigsDescriptionThe response is the length of odontoblasts (cells responsible for
tooth growth) in 60 guinea pigs. Each animal received one of three
dose levels of vitamin C (0.5, 1, and 2 mg/day) by one of two delivery
methods, (orange juice or ascorbic acid (a form of vitamin C and coded
as UsageToothGrowth FormatA data frame with 60 observations on 3 variables.
SourceC. I. Bliss (1952) The Statistics of Bioassay. Academic Press. ReferencesMcNeil, D. R. (1977) Interactive Data Analysis. New York: Wiley. Crampton, E. W. (1947) The growth of the odontoblast of the incisor teeth as a criterion of vitamin C intake of the guinea pig. The Journal of Nutrition 33(5): 491–504. http://jn.nutrition.org/content/33/5/491.full.pdf Examples
require(graphics)
coplot(len ~ dose | supp, data = ToothGrowth, panel = panel.smooth,
       xlab = "ToothGrowth data: length vs dose, given type of supplement")
Results
R version 3.3.1 (2016-06-21) -- "Bug in Your Hair"
Copyright (C) 2016 The R Foundation for Statistical Computing
Platform: x86_64-pc-linux-gnu (64-bit)

R is free software and comes with ABSOLUTELY NO WARRANTY.
You are welcome to redistribute it under certain conditions.
Type 'license()' or 'licence()' for distribution details.

R is a collaborative project with many contributors.
Type 'contributors()' for more information and
'citation()' on how to cite R or R packages in publications.

Type 'demo()' for some demos, 'help()' for on-line help, or
'help.start()' for an HTML browser interface to help.
Type 'q()' to quit R.

> library(datasets)
> png(filename="/home/ddbj/snapshot/RGM3/R_rel/result/datasets/ToothGrowth.Rd_%03d_medium.png", width=480, height=480)
> ### Name: ToothGrowth
> ### Title: The Effect of Vitamin C on Tooth Growth in Guinea Pigs
> ### Aliases: ToothGrowth
> ### Keywords: datasets
>
> ### ** Examples
>
> require(graphics)
> coplot(len ~ dose | supp, data = ToothGrowth, panel = panel.smooth,
+        xlab = "ToothGrowth data: length vs dose, given type of supplement")
>
>
>
>
>
> dev.off()
null device
          1
>
|
Created & Maintained by Osamu Ogasawara (osamu.ogasawara@gmail.com) and 