Supported by Dr. Osamu Ogasawara and  . . |
|
Last data update: 2014.03.03 |
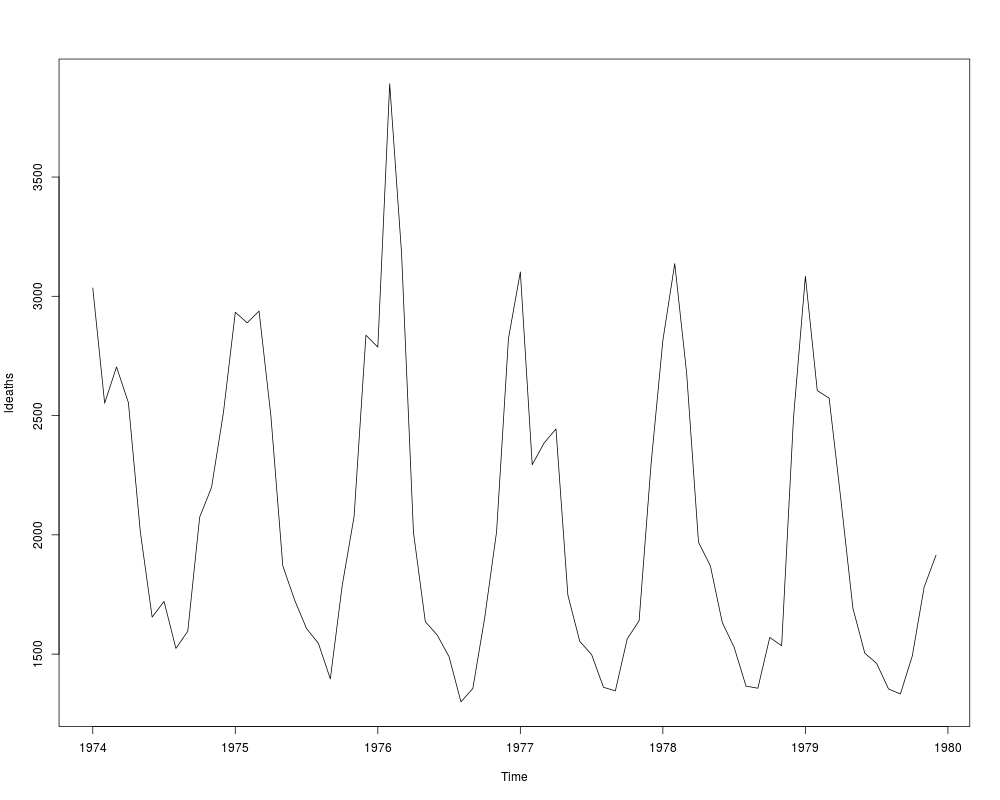
Monthly Deaths from Lung Diseases in the UKDescriptionThree time series giving the monthly deaths from bronchitis,
emphysema and asthma in the UK, 1974–1979,
both sexes ( Usageldeaths fdeaths mdeaths SourceP. J. Diggle (1990) Time Series: A Biostatistical Introduction. Oxford, table A.3 Examples
require(stats); require(graphics) # for time
plot(ldeaths)
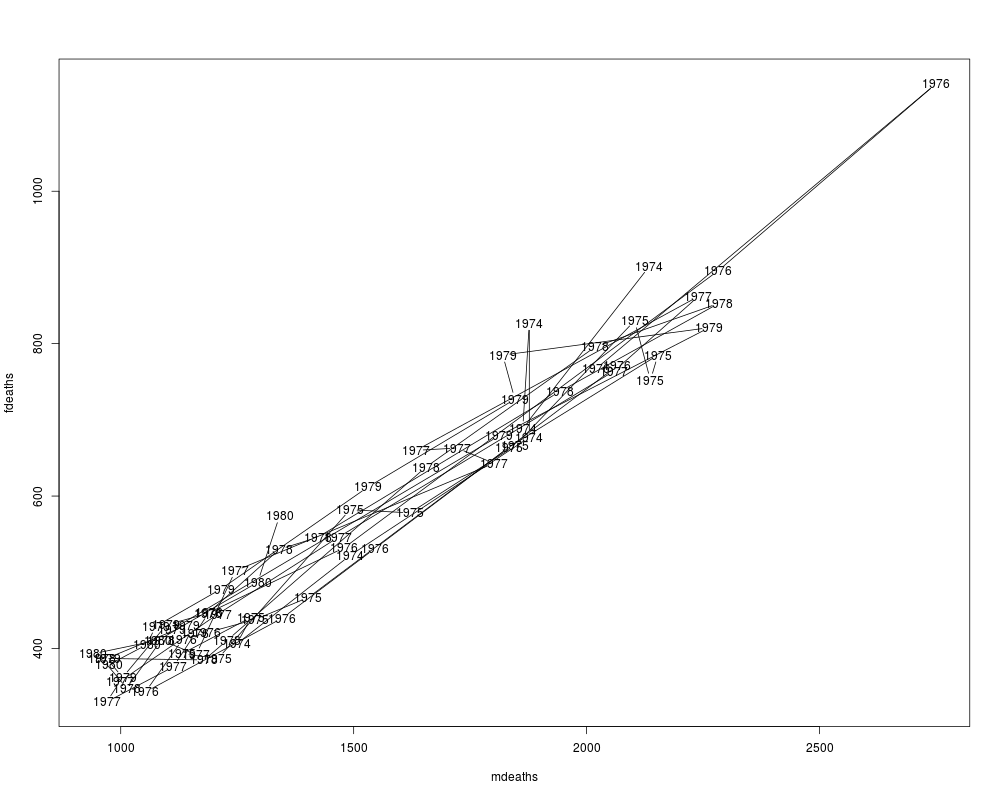
plot(mdeaths, fdeaths)
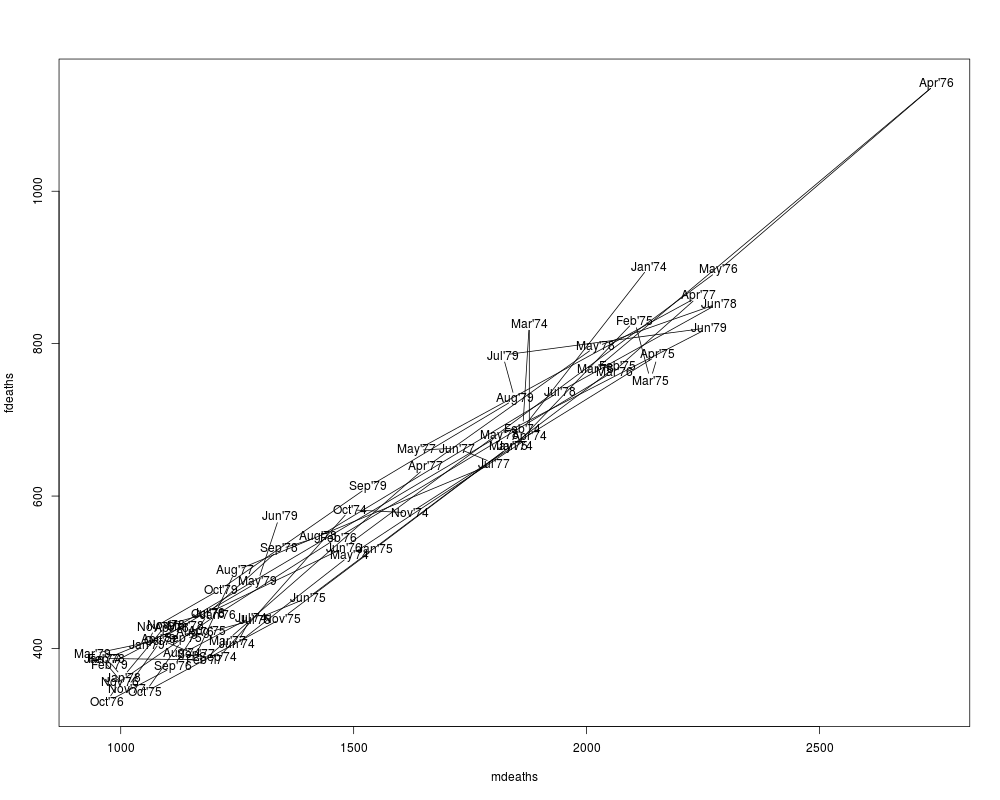
## Better labels:
yr <- floor(tt <- time(mdeaths))
plot(mdeaths, fdeaths,
xy.labels = paste(month.abb[12*(tt - yr)], yr-1900, sep = "'"))
Results
R version 3.3.1 (2016-06-21) -- "Bug in Your Hair"
Copyright (C) 2016 The R Foundation for Statistical Computing
Platform: x86_64-pc-linux-gnu (64-bit)

R is free software and comes with ABSOLUTELY NO WARRANTY.
You are welcome to redistribute it under certain conditions.
Type 'license()' or 'licence()' for distribution details.

R is a collaborative project with many contributors.
Type 'contributors()' for more information and
'citation()' on how to cite R or R packages in publications.

Type 'demo()' for some demos, 'help()' for on-line help, or
'help.start()' for an HTML browser interface to help.
Type 'q()' to quit R.

> library(datasets)
> png(filename="/home/ddbj/snapshot/RGM3/R_rel/result/datasets/UKLungDeaths.Rd_%03d_medium.png", width=480, height=480)
> ### Name: UKLungDeaths
> ### Title: Monthly Deaths from Lung Diseases in the UK
> ### Aliases: UKLungDeaths ldeaths fdeaths mdeaths
> ### Keywords: datasets
>
> ### ** Examples
>
> require(stats); require(graphics) # for time
> plot(ldeaths)
> plot(mdeaths, fdeaths)
> ## Better labels:
> yr <- floor(tt <- time(mdeaths))
> plot(mdeaths, fdeaths,
+      xy.labels = paste(month.abb[12*(tt - yr)], yr-1900, sep = "'"))
>
>
>
>
>
> dev.off()
null device
          1
>
|
Created & Maintained by Osamu Ogasawara (osamu.ogasawara@gmail.com) and 