Supported by Dr. Osamu Ogasawara and  . . |
|
Last data update: 2014.03.03 |
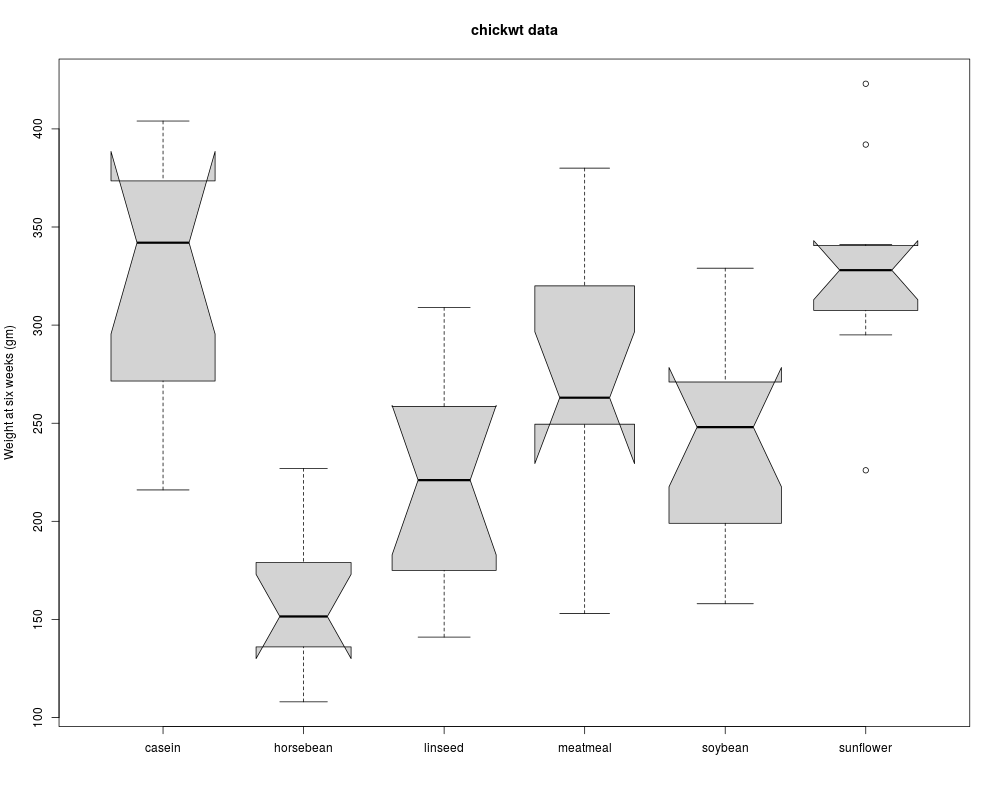
Chicken Weights by Feed TypeDescriptionAn experiment was conducted to measure and compare the effectiveness of various feed supplements on the growth rate of chickens. Usagechickwts FormatA data frame with 71 observations on the following 2 variables.
DetailsNewly hatched chicks were randomly allocated into six groups, and each group was given a different feed supplement. Their weights in grams after six weeks are given along with feed types. SourceAnonymous (1948) Biometrika, 35, 214. ReferencesMcNeil, D. R. (1977) Interactive Data Analysis. New York: Wiley. Examples
require(stats); require(graphics)
boxplot(weight ~ feed, data = chickwts, col = "lightgray",
varwidth = TRUE, notch = TRUE, main = "chickwt data",
ylab = "Weight at six weeks (gm)")
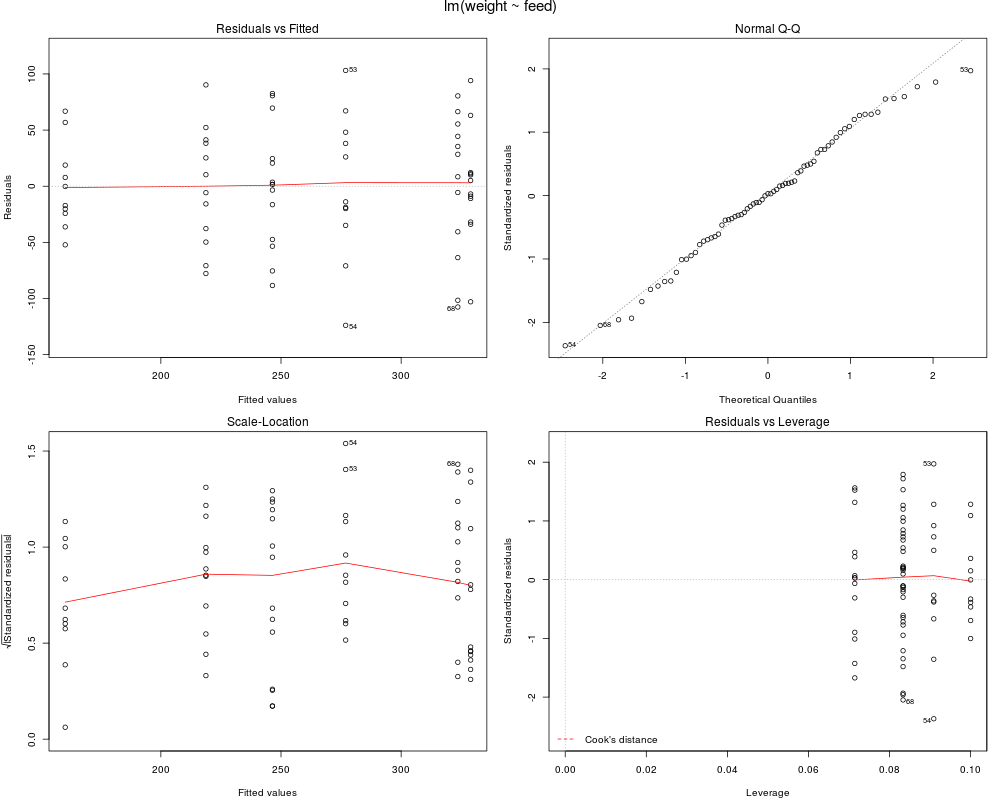
anova(fm1 <- lm(weight ~ feed, data = chickwts))
opar <- par(mfrow = c(2, 2), oma = c(0, 0, 1.1, 0),
mar = c(4.1, 4.1, 2.1, 1.1))
plot(fm1)
par(opar)
Results
R version 3.3.1 (2016-06-21) -- "Bug in Your Hair"
Copyright (C) 2016 The R Foundation for Statistical Computing
Platform: x86_64-pc-linux-gnu (64-bit)

R is free software and comes with ABSOLUTELY NO WARRANTY.
You are welcome to redistribute it under certain conditions.
Type 'license()' or 'licence()' for distribution details.

R is a collaborative project with many contributors.
Type 'contributors()' for more information and
'citation()' on how to cite R or R packages in publications.

Type 'demo()' for some demos, 'help()' for on-line help, or
'help.start()' for an HTML browser interface to help.
Type 'q()' to quit R.

> library(datasets)
> png(filename="/home/ddbj/snapshot/RGM3/R_rel/result/datasets/chickwts.Rd_%03d_medium.png", width=480, height=480)
> ### Name: chickwts
> ### Title: Chicken Weights by Feed Type
> ### Aliases: chickwts
> ### Keywords: datasets
>
> ### ** Examples
>
> require(stats); require(graphics)
> boxplot(weight ~ feed, data = chickwts, col = "lightgray",
+     varwidth = TRUE, notch = TRUE, main = "chickwt data",
+     ylab = "Weight at six weeks (gm)")
Warning message:
In bxp(list(stats = c(216, 271.5, 342, 373.5, 404, 108, 136, 151.5,  :
  some notches went outside hinges ('box'): maybe set notch=FALSE
> anova(fm1 <- lm(weight ~ feed, data = chickwts))
Analysis of Variance Table

Response: weight
          Df Sum Sq Mean Sq F value    Pr(>F)
feed       5 231129   46226  15.365 5.936e-10 ***
Residuals 65 195556    3009
---
Signif. codes:  0 '***' 0.001 '**' 0.01 '*' 0.05 '.' 0.1 ' ' 1
> opar <- par(mfrow = c(2, 2), oma = c(0, 0, 1.1, 0),
+             mar = c(4.1, 4.1, 2.1, 1.1))
> plot(fm1)
> par(opar)
>
>
>
>
>
> dev.off()
null device
          1
>
|
Created & Maintained by Osamu Ogasawara (osamu.ogasawara@gmail.com) and 