Supported by Dr. Osamu Ogasawara and  . . |
|
Last data update: 2014.03.03 |
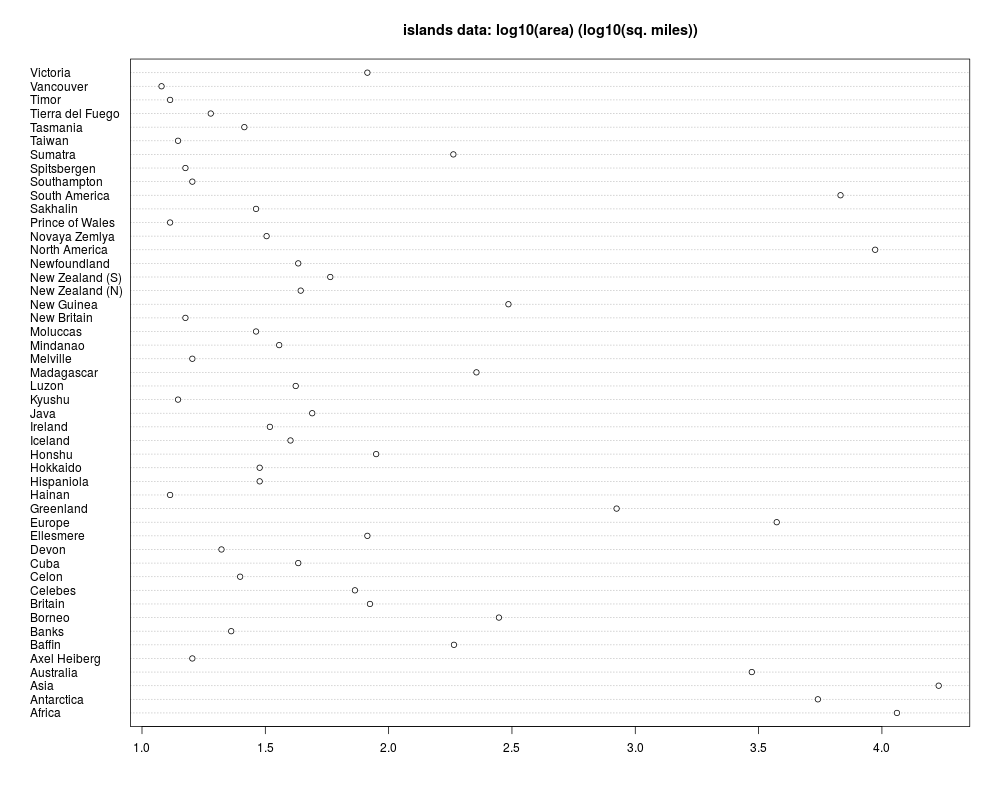
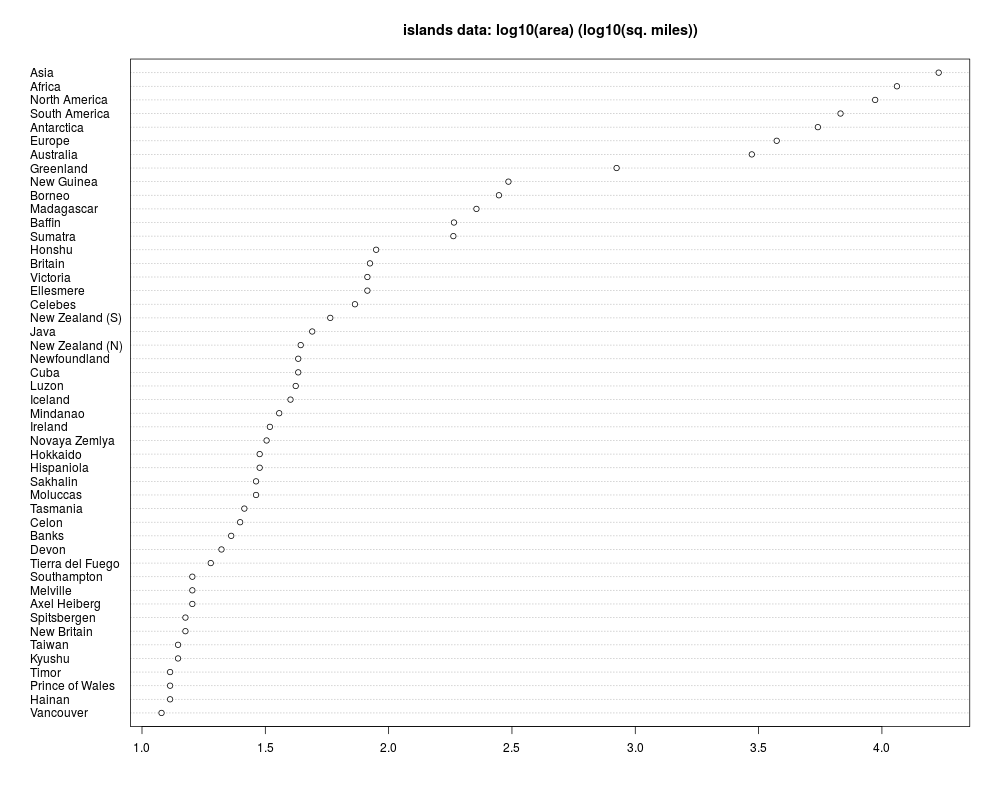
Areas of the World's Major LandmassesDescriptionThe areas in thousands of square miles of the landmasses which exceed 10,000 square miles. Usageislands FormatA named vector of length 48. SourceThe World Almanac and Book of Facts, 1975, page 406. ReferencesMcNeil, D. R. (1977) Interactive Data Analysis. Wiley. Examplesrequire(graphics) dotchart(log(islands, 10), main = "islands data: log10(area) (log10(sq. miles))") dotchart(log(islands[order(islands)], 10), main = "islands data: log10(area) (log10(sq. miles))") Results
R version 3.3.1 (2016-06-21) -- "Bug in Your Hair"
Copyright (C) 2016 The R Foundation for Statistical Computing
Platform: x86_64-pc-linux-gnu (64-bit)

R is free software and comes with ABSOLUTELY NO WARRANTY.
You are welcome to redistribute it under certain conditions.
Type 'license()' or 'licence()' for distribution details.

R is a collaborative project with many contributors.
Type 'contributors()' for more information and
'citation()' on how to cite R or R packages in publications.

Type 'demo()' for some demos, 'help()' for on-line help, or
'help.start()' for an HTML browser interface to help.
Type 'q()' to quit R.

> library(datasets)
> png(filename="/home/ddbj/snapshot/RGM3/R_rel/result/datasets/islands.Rd_%03d_medium.png", width=480, height=480)
> ### Name: islands
> ### Title: Areas of the World's Major Landmasses
> ### Aliases: islands
> ### Keywords: datasets
>
> ### ** Examples
>
> require(graphics)
> dotchart(log(islands, 10),
+    main = "islands data: log10(area) (log10(sq. miles))")
> dotchart(log(islands[order(islands)], 10),
+    main = "islands data: log10(area) (log10(sq. miles))")
>
>
>
>
>
> dev.off()
null device
          1
>
|
Created & Maintained by Osamu Ogasawara (osamu.ogasawara@gmail.com) and 