Supported by Dr. Osamu Ogasawara and  . . |
|
Last data update: 2014.03.03 |
Student's Sleep DataDescriptionData which show the effect of two soporific drugs (increase in hours of sleep compared to control) on 10 patients. Usagesleep FormatA data frame with 20 observations on 3 variables.
DetailsThe SourceCushny, A. R. and Peebles, A. R. (1905) The action of optical isomers: II hyoscines. The Journal of Physiology 32, 501–510. Student (1908) The probable error of the mean. Biometrika, 6, 20. ReferencesScheffé, Henry (1959) The Analysis of Variance. New York, NY: Wiley. Examples
require(stats)
## Student's paired t-test
with(sleep,
t.test(extra[group == 1],
extra[group == 2], paired = TRUE))
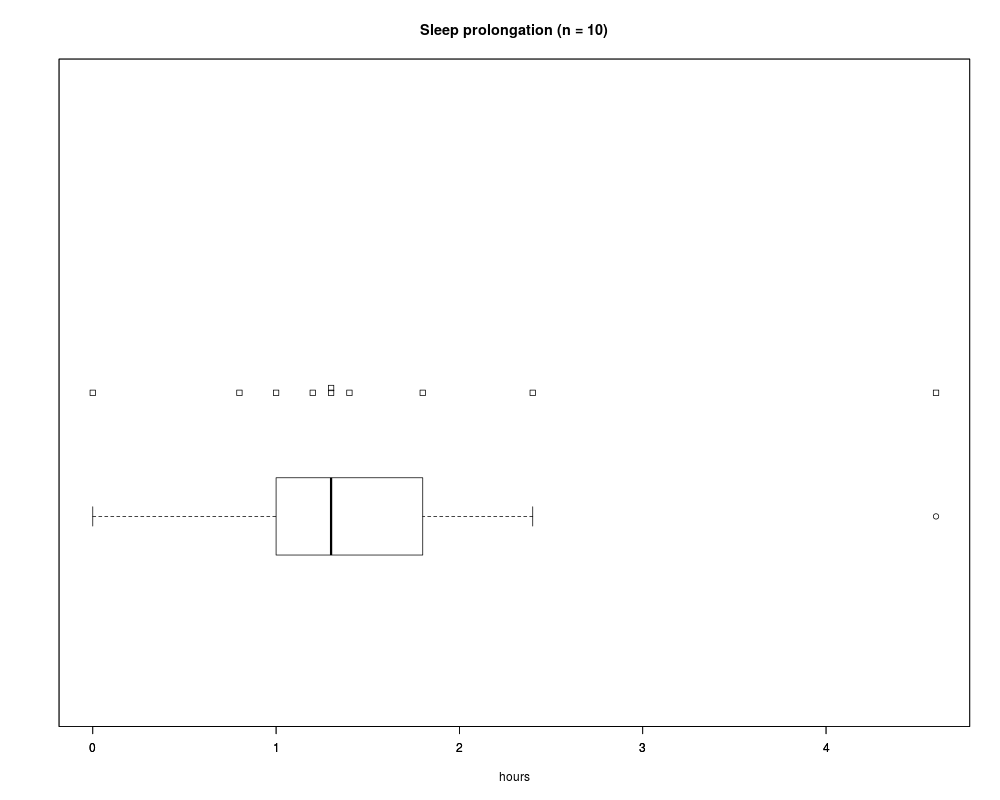
## The sleep *prolongations*
sleep1 <- with(sleep, extra[group == 2] - extra[group == 1])
summary(sleep1)
stripchart(sleep1, method = "stack", xlab = "hours",
main = "Sleep prolongation (n = 10)")
boxplot(sleep1, horizontal = TRUE, add = TRUE,
at = .6, pars = list(boxwex = 0.5, staplewex = 0.25))
Results
R version 3.3.1 (2016-06-21) -- "Bug in Your Hair"
Copyright (C) 2016 The R Foundation for Statistical Computing
Platform: x86_64-pc-linux-gnu (64-bit)

R is free software and comes with ABSOLUTELY NO WARRANTY.
You are welcome to redistribute it under certain conditions.
Type 'license()' or 'licence()' for distribution details.

R is a collaborative project with many contributors.
Type 'contributors()' for more information and
'citation()' on how to cite R or R packages in publications.

Type 'demo()' for some demos, 'help()' for on-line help, or
'help.start()' for an HTML browser interface to help.
Type 'q()' to quit R.

> library(datasets)
> png(filename="/home/ddbj/snapshot/RGM3/R_rel/result/datasets/sleep.Rd_%03d_medium.png", width=480, height=480)
> ### Name: sleep
> ### Title: Student's Sleep Data
> ### Aliases: sleep
> ### Keywords: datasets
>
> ### ** Examples
>
> require(stats)
> ## Student's paired t-test
> with(sleep,
+      t.test(extra[group == 1],
+             extra[group == 2], paired = TRUE))

	Paired t-test

data:  extra[group == 1] and extra[group == 2]
t = -4.0621, df = 9, p-value = 0.002833
alternative hypothesis: true difference in means is not equal to 0
95 percent confidence interval:
 -2.4598858 -0.7001142
sample estimates:
mean of the differences
                  -1.58

>
> ## The sleep *prolongations*
> sleep1 <- with(sleep, extra[group == 2] - extra[group == 1])
> summary(sleep1)
   Min. 1st Qu.  Median    Mean 3rd Qu.    Max.
   0.00    1.05    1.30    1.58    1.70    4.60
> stripchart(sleep1, method = "stack", xlab = "hours",
+            main = "Sleep prolongation (n = 10)")
> boxplot(sleep1, horizontal = TRUE, add = TRUE,
+         at = .6, pars = list(boxwex = 0.5, staplewex = 0.25))
>
>
>
>
>
> dev.off()
null device
          1
>
|
Created & Maintained by Osamu Ogasawara (osamu.ogasawara@gmail.com) and 