Supported by Dr. Osamu Ogasawara and  . . |
|
Last data update: 2014.03.03 |
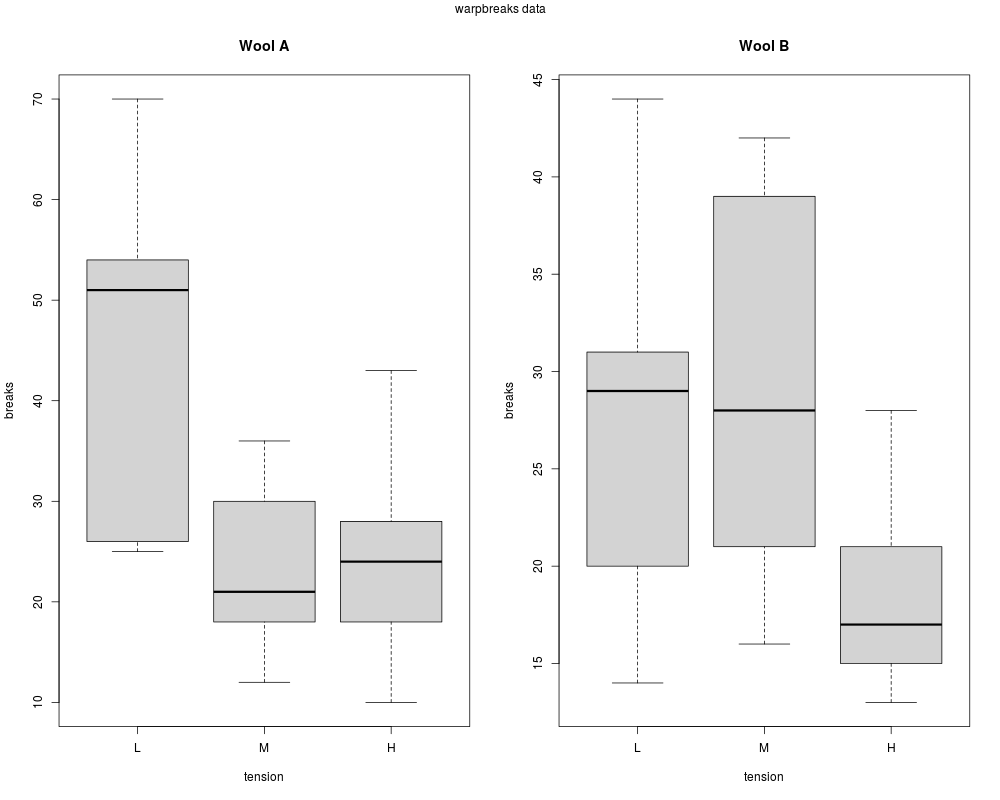
The Number of Breaks in Yarn during WeavingDescriptionThis data set gives the number of warp breaks per loom, where a loom corresponds to a fixed length of yarn. Usagewarpbreaks FormatA data frame with 54 observations on 3 variables.
There are measurements on 9 looms for each of the six types of warp
( SourceTippett, L. H. C. (1950) Technological Applications of Statistics. Wiley. Page 106. ReferencesTukey, J. W. (1977) Exploratory Data Analysis. Addison-Wesley. McNeil, D. R. (1977) Interactive Data Analysis. Wiley. See Also
Examples
require(stats); require(graphics)
summary(warpbreaks)
opar <- par(mfrow = c(1, 2), oma = c(0, 0, 1.1, 0))
plot(breaks ~ tension, data = warpbreaks, col = "lightgray",
     varwidth = TRUE, subset = wool == "A", main = "Wool A")
plot(breaks ~ tension, data = warpbreaks, col = "lightgray",
     varwidth = TRUE, subset = wool == "B", main = "Wool B")
mtext("warpbreaks data", side = 3, outer = TRUE)
par(opar)
summary(fm1 <- lm(breaks ~ wool*tension, data = warpbreaks))
anova(fm1)
Results
R version 3.3.1 (2016-06-21) -- "Bug in Your Hair"
Copyright (C) 2016 The R Foundation for Statistical Computing
Platform: x86_64-pc-linux-gnu (64-bit)

R is free software and comes with ABSOLUTELY NO WARRANTY.
You are welcome to redistribute it under certain conditions.
Type 'license()' or 'licence()' for distribution details.

R is a collaborative project with many contributors.
Type 'contributors()' for more information and
'citation()' on how to cite R or R packages in publications.

Type 'demo()' for some demos, 'help()' for on-line help, or
'help.start()' for an HTML browser interface to help.
Type 'q()' to quit R.

> library(datasets)
> png(filename="/home/ddbj/snapshot/RGM3/R_rel/result/datasets/warpbreaks.Rd_%03d_medium.png", width=480, height=480)
> ### Name: warpbreaks
> ### Title: The Number of Breaks in Yarn during Weaving
> ### Aliases: warpbreaks
> ### Keywords: datasets
>
> ### ** Examples
>
> require(stats); require(graphics)
> summary(warpbreaks)
     breaks      wool   tension
 Min.   :10.00   A:27   L:18
 1st Qu.:18.25   B:27   M:18
 Median :26.00          H:18
 Mean   :28.15
 3rd Qu.:34.00
 Max.   :70.00
> opar <- par(mfrow = c(1, 2), oma = c(0, 0, 1.1, 0))
> plot(breaks ~ tension, data = warpbreaks, col = "lightgray",
+      varwidth = TRUE, subset = wool == "A", main = "Wool A")
> plot(breaks ~ tension, data = warpbreaks, col = "lightgray",
+      varwidth = TRUE, subset = wool == "B", main = "Wool B")
> mtext("warpbreaks data", side = 3, outer = TRUE)
> par(opar)
> summary(fm1 <- lm(breaks ~ wool*tension, data = warpbreaks))

Call:
lm(formula = breaks ~ wool * tension, data = warpbreaks)

Residuals:
     Min       1Q   Median       3Q      Max
-19.5556  -6.8889  -0.6667   7.1944  25.4444

Coefficients:
               Estimate Std. Error t value Pr(>|t|)
(Intercept)      44.556      3.647  12.218 2.43e-16 ***
woolB           -16.333      5.157  -3.167 0.002677 **
tensionM        -20.556      5.157  -3.986 0.000228 ***
tensionH        -20.000      5.157  -3.878 0.000320 ***
woolB:tensionM   21.111      7.294   2.895 0.005698 **
woolB:tensionH   10.556      7.294   1.447 0.154327
---
Signif. codes:  0 '***' 0.001 '**' 0.01 '*' 0.05 '.' 0.1 ' ' 1

Residual standard error: 10.94 on 48 degrees of freedom
Multiple R-squared:  0.3778,	Adjusted R-squared:  0.3129
F-statistic: 5.828 on 5 and 48 DF,  p-value: 0.0002772

> anova(fm1)
Analysis of Variance Table

Response: breaks
             Df Sum Sq Mean Sq F value    Pr(>F)
wool          1  450.7  450.67  3.7653 0.0582130 .
tension       2 2034.3 1017.13  8.4980 0.0006926 ***
wool:tension  2 1002.8  501.39  4.1891 0.0210442 *
Residuals    48 5745.1  119.69
---
Signif. codes:  0 '***' 0.001 '**' 0.01 '*' 0.05 '.' 0.1 ' ' 1
>
>
>
>
>
> dev.off()
null device
          1
>
|
Created & Maintained by Osamu Ogasawara (osamu.ogasawara@gmail.com) and 