Supported by Dr. Osamu Ogasawara and  . . |
|
Last data update: 2014.03.03 |
Segment geoms for GRanges objectDescriptionShow interval data as vertical bar, width equals to interval width and use 'score' or specified 'y' as y scale. Usage## S4 method for signature 'ANY' geom_bar(data, ...) ## S4 method for signature 'GRanges' geom_bar(data,..., xlab, ylab, main) Arguments
DetailsUseful for showing bed like files, when imported as GRanges, have a extra 'score' column, use it as default y, you could also specify y by using aes(y = ). ValueA 'Layer'. Examples
## load
library(GenomicRanges)
## simul
set.seed(123)
gr.b <- GRanges(seqnames = "chr1", IRanges(start = seq(1, 100, by = 10),
width = sample(4:9, size = 10, replace = TRUE)),
score = rnorm(10, 10, 3), value = runif(10, 1, 100))
gr.b2 <- GRanges(seqnames = "chr2", IRanges(start = seq(1, 100, by = 10),
width = sample(4:9, size = 10, replace = TRUE)),
score = rnorm(10, 10, 3), value = runif(10, 1, 100))
gr.b <- c(gr.b, gr.b2)
## default use score as y
## bar
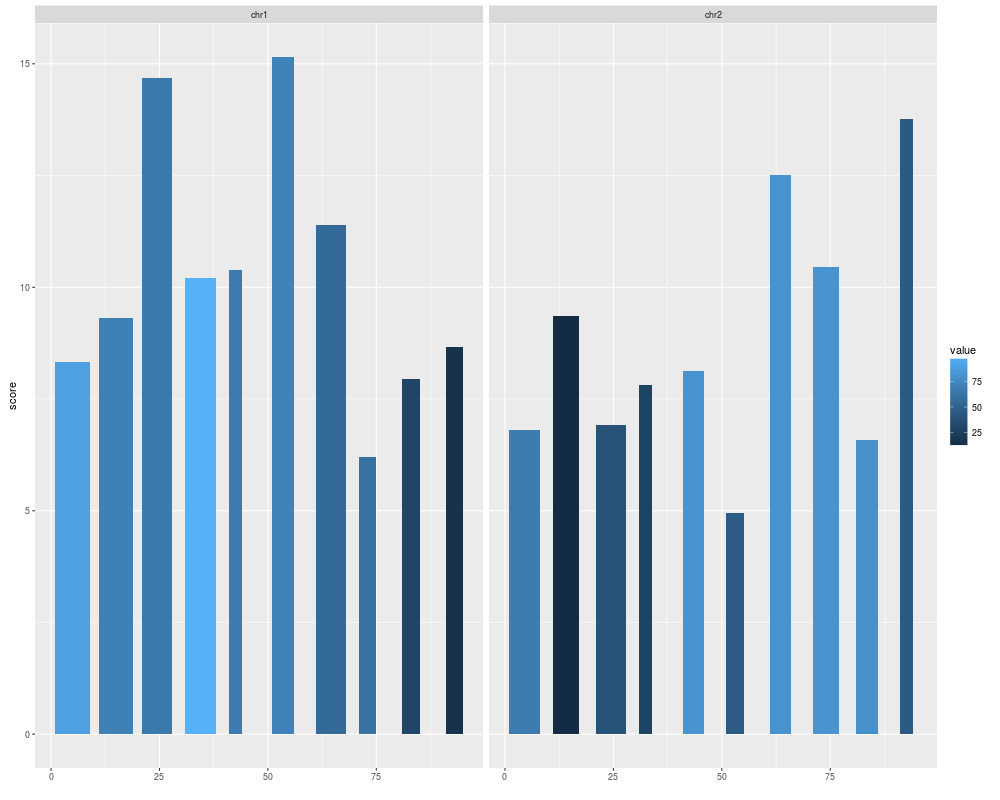
ggplot(gr.b) + geom_bar(aes(fill = value))
## or
ggplot() + geom_bar(gr.b, aes(fill = value))
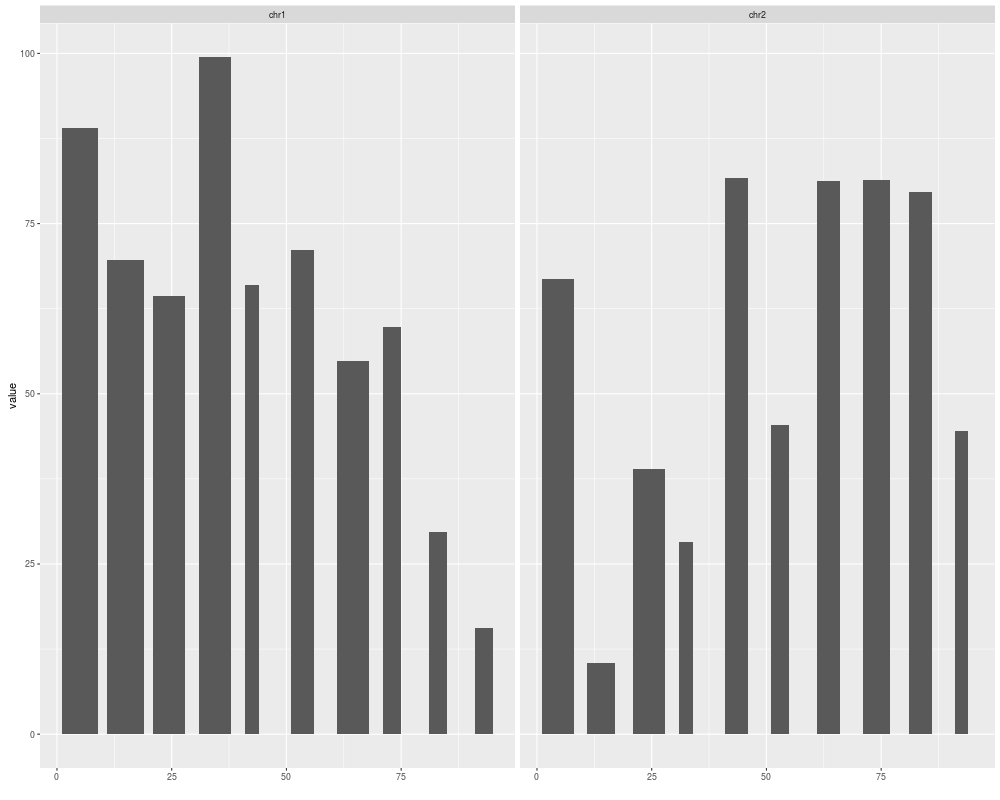
ggplot(gr.b) + geom_bar(aes(y = value))
## equal to
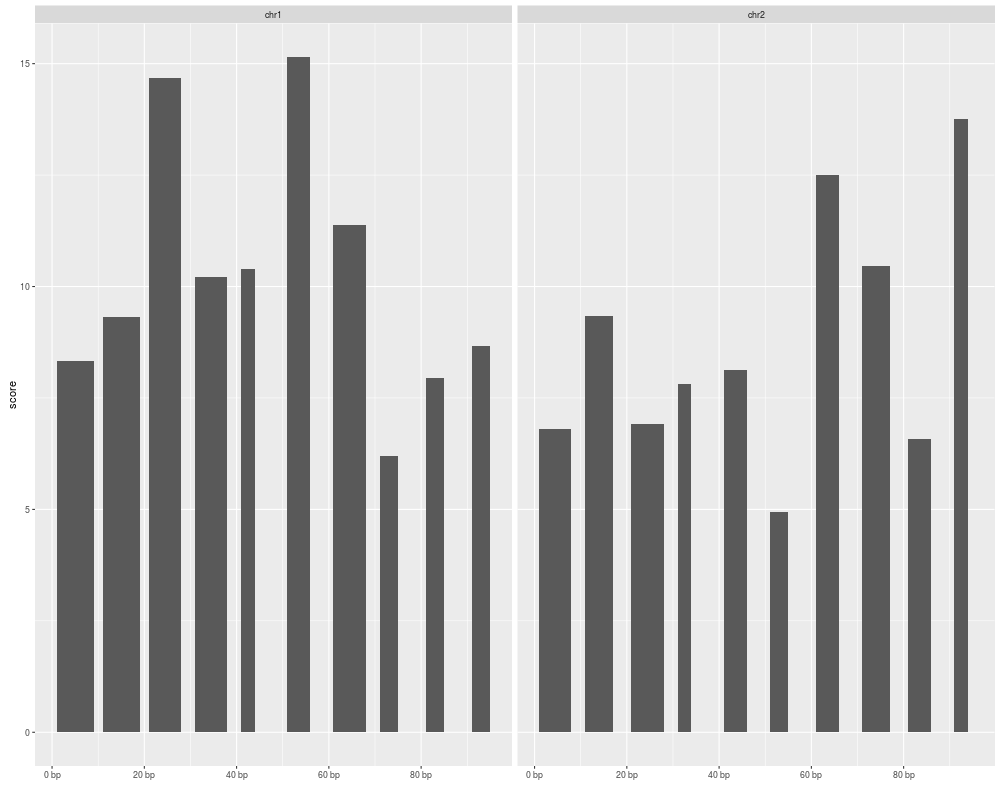
autoplot(gr.b, geom = "bar")
Results
R version 3.3.1 (2016-06-21) -- "Bug in Your Hair"
Copyright (C) 2016 The R Foundation for Statistical Computing
Platform: x86_64-pc-linux-gnu (64-bit)

R is free software and comes with ABSOLUTELY NO WARRANTY.
You are welcome to redistribute it under certain conditions.
Type 'license()' or 'licence()' for distribution details.

R is a collaborative project with many contributors.
Type 'contributors()' for more information and
'citation()' on how to cite R or R packages in publications.

Type 'demo()' for some demos, 'help()' for on-line help, or
'help.start()' for an HTML browser interface to help.
Type 'q()' to quit R.

> library(ggbio)
Loading required package: BiocGenerics
Loading required package: parallel

Attaching package: 'BiocGenerics'

The following objects are masked from 'package:parallel':

    clusterApply, clusterApplyLB, clusterCall, clusterEvalQ,
    clusterExport, clusterMap, parApply, parCapply, parLapply,
    parLapplyLB, parRapply, parSapply, parSapplyLB

The following objects are masked from 'package:stats':

    IQR, mad, xtabs

The following objects are masked from 'package:base':

    Filter, Find, Map, Position, Reduce, anyDuplicated, append,
    as.data.frame, cbind, colnames, do.call, duplicated, eval, evalq,
    get, grep, grepl, intersect, is.unsorted, lapply, lengths, mapply,
    match, mget, order, paste, pmax, pmax.int, pmin, pmin.int, rank,
    rbind, rownames, sapply, setdiff, sort, table, tapply, union,
    unique, unsplit

Loading required package: ggplot2
Need specific help about ggbio? try mailing
 the maintainer or visit http://tengfei.github.com/ggbio/

Attaching package: 'ggbio'

The following objects are masked from 'package:ggplot2':

    geom_bar, geom_rect, geom_segment, ggsave, stat_bin, stat_identity,
    xlim

Warning message:
replacing previous import 'ggplot2::Position' by 'BiocGenerics::Position' when loading 'ggbio'
> png(filename="/home/ddbj/snapshot/RGM3/R_BC/result/ggbio/geom_bar-method.Rd_%03d_medium.png", width=480, height=480)
> ### Name: geom_bar
> ### Title: Segment geoms for GRanges object
> ### Aliases: geom_bar geom_bar,ANY-method geom_bar,GRanges-method
> ###   geom_bar,missing-method geom_bar,chevron-method
>
> ### ** Examples
>
> ## load
> library(GenomicRanges)
Loading required package: S4Vectors
Loading required package: stats4

Attaching package: 'S4Vectors'

The following objects are masked from 'package:base':

    colMeans, colSums, expand.grid, rowMeans, rowSums

Loading required package: IRanges
Loading required package: GenomeInfoDb
>
> ## simul
> set.seed(123)
> gr.b <- GRanges(seqnames = "chr1", IRanges(start = seq(1, 100, by = 10),
+                   width = sample(4:9, size = 10, replace = TRUE)),
+                 score = rnorm(10, 10, 3), value = runif(10, 1, 100))
> gr.b2 <- GRanges(seqnames = "chr2", IRanges(start = seq(1, 100, by = 10),
+                   width = sample(4:9, size = 10, replace = TRUE)),
+                 score = rnorm(10, 10, 3), value = runif(10, 1, 100))
> gr.b <- c(gr.b, gr.b2)
Warning message:
In .Seqinfo.mergexy(x, y) :
  The 2 combined objects have no sequence levels in common. (Use
  suppressWarnings() to suppress this warning.)
> ## default use score as y
>
> ## bar
> ggplot(gr.b) + geom_bar(aes(fill = value))
use score as y by default
> ## or
> ggplot() + geom_bar(gr.b, aes(fill = value))
use score as y by default
> ggplot(gr.b) + geom_bar(aes(y = value))
> ## equal to
> autoplot(gr.b, geom = "bar")
use score as y by default
>
>
>
>
>
> dev.off()
null device
          1
>
|

Created & Maintained by Osamu Ogasawara (osamu.ogasawara@gmail.com) and 