Supported by Dr. Osamu Ogasawara and  . . |
|
Last data update: 2014.03.03 |
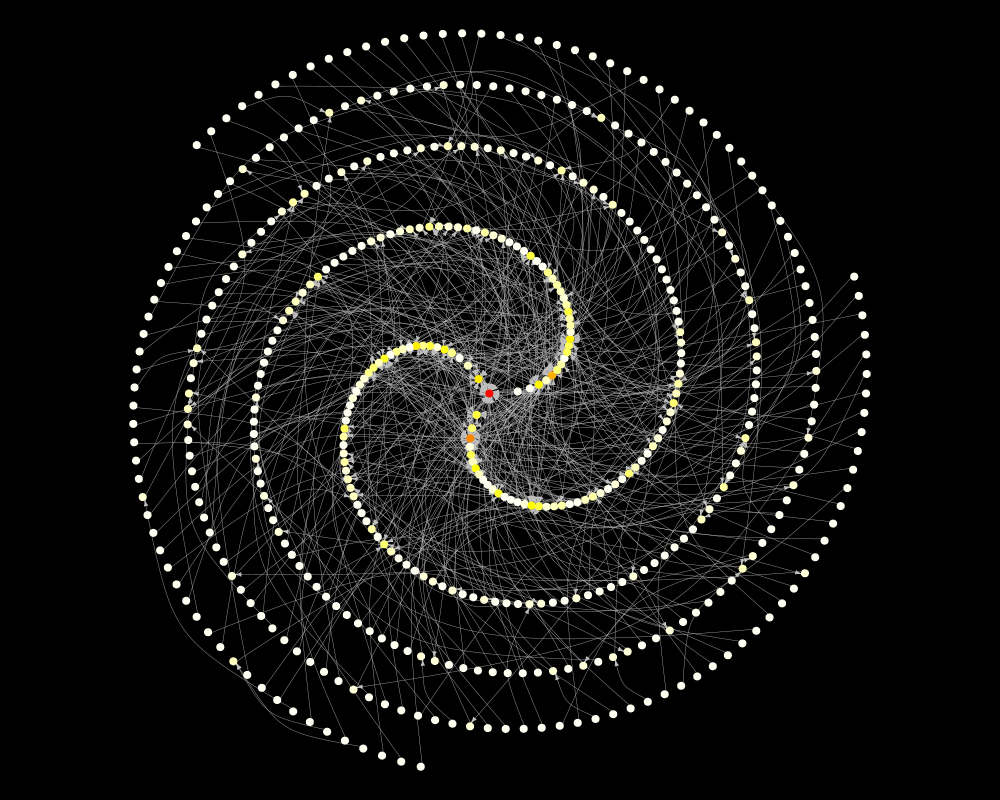
Exploratory visualization of information spread of biological networksDescriptionPlots a graph in a spirical fashion, highly connected nodes are placed at center. Usage## S3 method for class 'spiral.graph' plot(x, tp=61, vertex.color=NULL, color.random=FALSE, rank.function=NULL,tkplot=FALSE, v.size=2, e.size=.5,e.curve=.5, v.lab=FALSE, bg="black", e.col="grey", skip=0, ...) Arguments
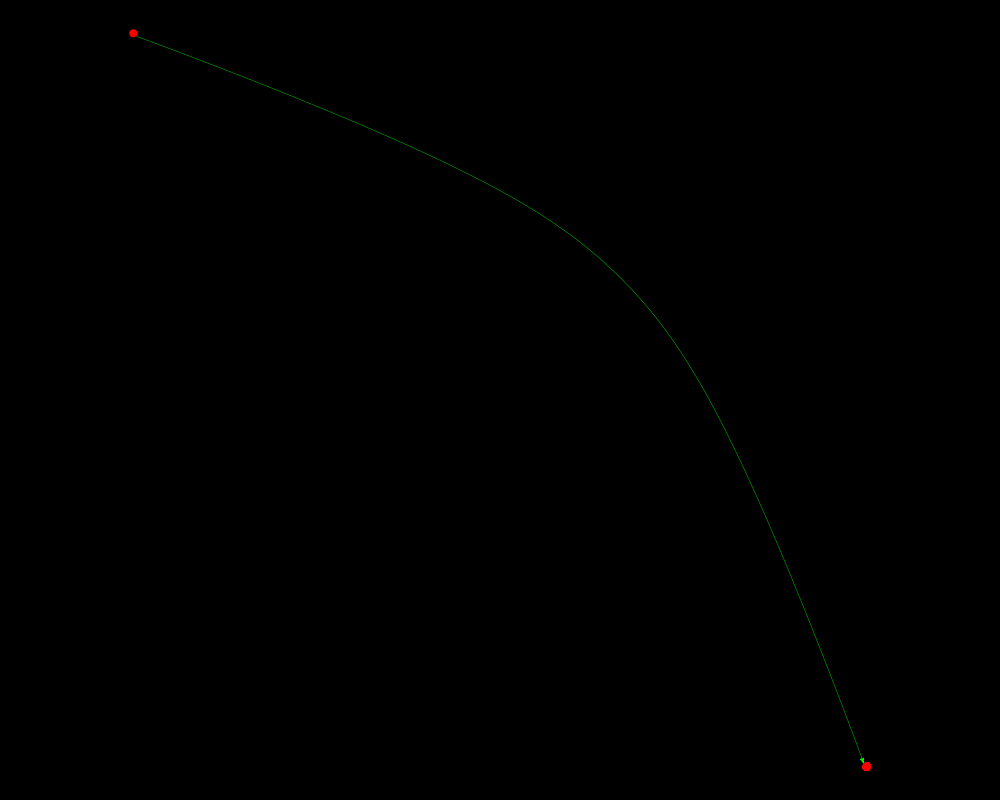
DetailsThis layout function plots network in a spiral fashion. Valuereturns a list object of 'netbiov' class Author(s)Shailesh Tripathi, Frank Emmert-Streib ReferencesExamplesg <- barabasi.game(500) x <- plot.spiral.graph(g, 121 ) x <- plot.spiral.graph(g, 120,rank.function=layout.reingold.tilford, vertex.color="red", e.col="green") Results
R version 3.3.1 (2016-06-21) -- "Bug in Your Hair"
Copyright (C) 2016 The R Foundation for Statistical Computing
Platform: x86_64-pc-linux-gnu (64-bit)

R is free software and comes with ABSOLUTELY NO WARRANTY.
You are welcome to redistribute it under certain conditions.
Type 'license()' or 'licence()' for distribution details.

R is a collaborative project with many contributors.
Type 'contributors()' for more information and
'citation()' on how to cite R or R packages in publications.

Type 'demo()' for some demos, 'help()' for on-line help, or
'help.start()' for an HTML browser interface to help.
Type 'q()' to quit R.

> library(netbiov)
Loading required package: igraph

Attaching package: 'igraph'

The following objects are masked from 'package:stats':

    decompose, spectrum

The following object is masked from 'package:base':

    union

> png(filename="/home/ddbj/snapshot/RGM3/R_BC/result/netbiov/plot.spiral.graph.Rd_%03d_medium.png", width=480, height=480)
> ### Name: plot.spiral.graph
> ### Title: Exploratory visualization of information spread of biological
> ###   networks
> ### Aliases: plot.spiral.graph
>
> ### ** Examples
>
>   g <- barabasi.game(500)
>   x <- plot.spiral.graph(g, 121 )
>   x <- plot.spiral.graph(g, 120,rank.function=layout.reingold.tilford,
+ vertex.color="red", e.col="green")
>
>
>
>
>
> dev.off()
null device
          1
>
|