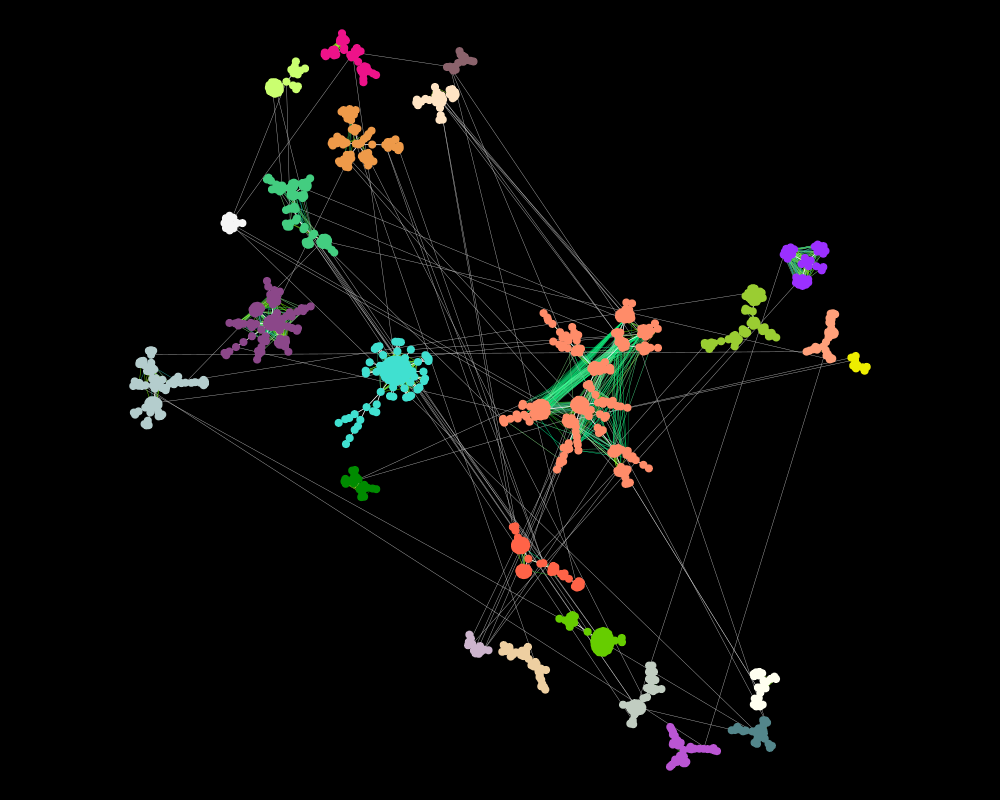
A large complex network is plotted by splitting it into its modules. The positions of the vertices in each subnetwork are determined by using the
fruchterman-reingold algorithm or the Kamada-kawai algorithm for the minimum spanning tree of each subnetwork. The edges of the minimum spanning tree are shown in black color.
x is a graph object, created using igraph package.
layout.function
is a 'function' class or a vector of functions to plot the layout of each module by a function in 'layout.function'.
mod.list
mod.list is a list object, which provides a modular information about the graph, each components of mod.list contains a vector of nodes to be plotted.
v.size
is a numeric value or a numeric vector which contains values to assign the size of the nodes.
e.size
is a numeric value to assign the width to edges.
e.lab.cex
is a numeric variable; this determines the size of the labels of the vertices or the modules.
lab.dist
is a numeric variable; this adjusts labels of vertices.
sf.modules
is an integer variable is used to scale up or scale down the graph plot.
v.sf
is a numeric value. This is used to adjust vertex size when v.size input is a numeric vector.
mst.edge.col
This option assigns a color to the edges of the minimum spanning tree of each module of graph 'g'. The default color is black for 'tkplot=TRUE'. If 'tkplot=FALSE' it is white.
random
random is a logical value, this option is used to choose nodes of split graphs randomly
colors
colors is a vector of colors. This option is a vector of the edge colors to assign colors to the edges of the graph.
vertex.color
vertex.colors is a vector of colors to assign colors to the vertices of the modules of the graph.
random.v.color
is a logical value, this option is used to assign colors to the vertices colors of the modules, colors for modules are picked randomly.
in.con.ed.col
is a scaler, assign colors to the edges which are showing connections between the modules.
tkplot
it is a boolean variable, if it is true function will use tkplot function to plot a graph, if it is false function will use plot function with a black background.
mst.e.size
is a numeric value which assigns the edge width to the edges of minimum spanning tree of the input graph.
v.lab
is a logical value to show vertex label.
v.lab.cex
is a numerical value to set the font size of vertex labels.
v.lab.col
is a hexadecimal character value to assign colors to vertex labels.
sf
is a numeric value. This is used to adjust vertex size when v.size input is a numeric vector.
bg
is a color value for background.
...
... parameter for other inputs.
Value
This function plots a graph using 'tkplot' function available in the 'igraph'.
This function returns a list,first component of list is a graph object, second component of the list contains x and y coordinates, third component of list contains color ids of edges of the graph etc.
Examples
  data("PPI_Athalina")
  data("modules_PPI_Athalina")
        id <- splitg.mst(g1, mod.list=lm, random.v.color=TRUE, tkplot=FALSE )
Results
R version 3.3.1 (2016-06-21) -- "Bug in Your Hair"
Copyright (C) 2016 The R Foundation for Statistical Computing
Platform: x86_64-pc-linux-gnu (64-bit)

R is free software and comes with ABSOLUTELY NO WARRANTY.
You are welcome to redistribute it under certain conditions.
Type 'license()' or 'licence()' for distribution details.

R is a collaborative project with many contributors.
Type 'contributors()' for more information and
'citation()' on how to cite R or R packages in publications.

Type 'demo()' for some demos, 'help()' for on-line help, or
'help.start()' for an HTML browser interface to help.
Type 'q()' to quit R.

> library(netbiov)
Loading required package: igraph

Attaching package: 'igraph'

The following objects are masked from 'package:stats':

    decompose, spectrum

The following object is masked from 'package:base':

    union

> png(filename="/home/ddbj/snapshot/RGM3/R_BC/result/netbiov/split.mst.Rd_%03d_medium.png", width=480, height=480)
> ### Name: splitg.mst
> ### Title: Network plot
> ### Aliases: splitg.mst split.mst
>
> ### ** Examples
>
>   data("PPI_Athalina")
>   data("modules_PPI_Athalina")
>         id <- splitg.mst(g1, mod.list=lm, random.v.color=TRUE, tkplot=FALSE )
>
>
>
>
>
> dev.off()
null device
          1
>
 .
.