Supported by Dr. Osamu Ogasawara and  . . |
|
Last data update: 2014.03.03 |
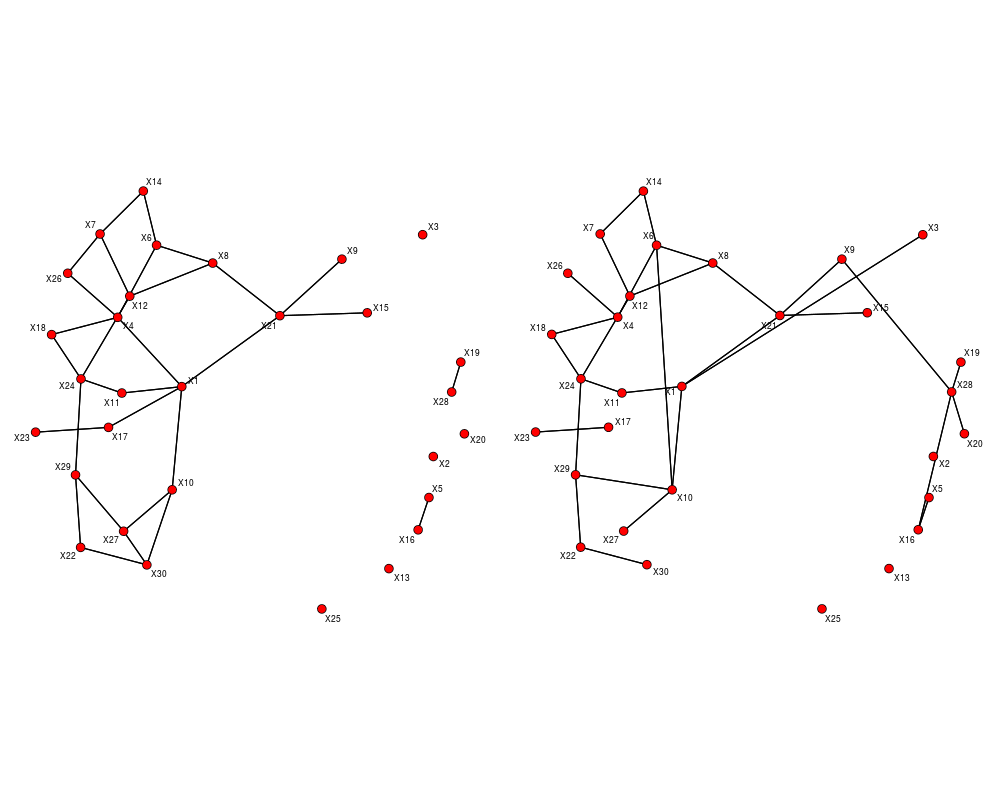
Plot two networks (GGMs)DescriptionPlot two networks (GGMs) Usage
plot_2networks(invcov1, invcov2, node.label = paste("X", 1:nrow(invcov1), sep
  = ""), main = c("", ""), ...)
Arguments
ValueFigure with two panels (for each network). Author(s)nicolas Examples
n <- 70
p <- 30

## Specifiy sparse inverse covariance matrices,
## with number of edges in common equal to ~ 0.8*p
gen.net <- generate_2networks(p,graph='random',n.nz=rep(p,2),
                              n.nz.common=ceiling(p*0.8))

invcov1 <- gen.net[[1]]
invcov2 <- gen.net[[2]]

plot_2networks(invcov1,invcov2,label.pos=0,label.cex=0.7)
Results
R version 3.3.1 (2016-06-21) -- "Bug in Your Hair"
Copyright (C) 2016 The R Foundation for Statistical Computing
Platform: x86_64-pc-linux-gnu (64-bit)

R is free software and comes with ABSOLUTELY NO WARRANTY.
You are welcome to redistribute it under certain conditions.
Type 'license()' or 'licence()' for distribution details.

R is a collaborative project with many contributors.
Type 'contributors()' for more information and
'citation()' on how to cite R or R packages in publications.

Type 'demo()' for some demos, 'help()' for on-line help, or
'help.start()' for an HTML browser interface to help.
Type 'q()' to quit R.

> library(nethet)
> png(filename="/home/ddbj/snapshot/RGM3/R_BC/result/nethet/plot_2networks.Rd_%03d_medium.png", width=480, height=480)
> ### Name: plot_2networks
> ### Title: Plot two networks (GGMs)
> ### Aliases: plot_2networks
>
> ### ** Examples
>
> n <- 70
> p <- 30
>
> ## Specifiy sparse inverse covariance matrices,
> ## with number of edges in common equal to ~ 0.8*p
> gen.net <- generate_2networks(p,graph='random',n.nz=rep(p,2),
+                               n.nz.common=ceiling(p*0.8))
>
> invcov1 <- gen.net[[1]]
> invcov2 <- gen.net[[2]]
>
> plot_2networks(invcov1,invcov2,label.pos=0,label.cex=0.7)
>
>
>
>
>
> dev.off()
null device
          1
>
|
Created & Maintained by Osamu Ogasawara (osamu.ogasawara@gmail.com) and 