Supported by Dr. Osamu Ogasawara and  . . |
|
Last data update: 2014.03.03 |
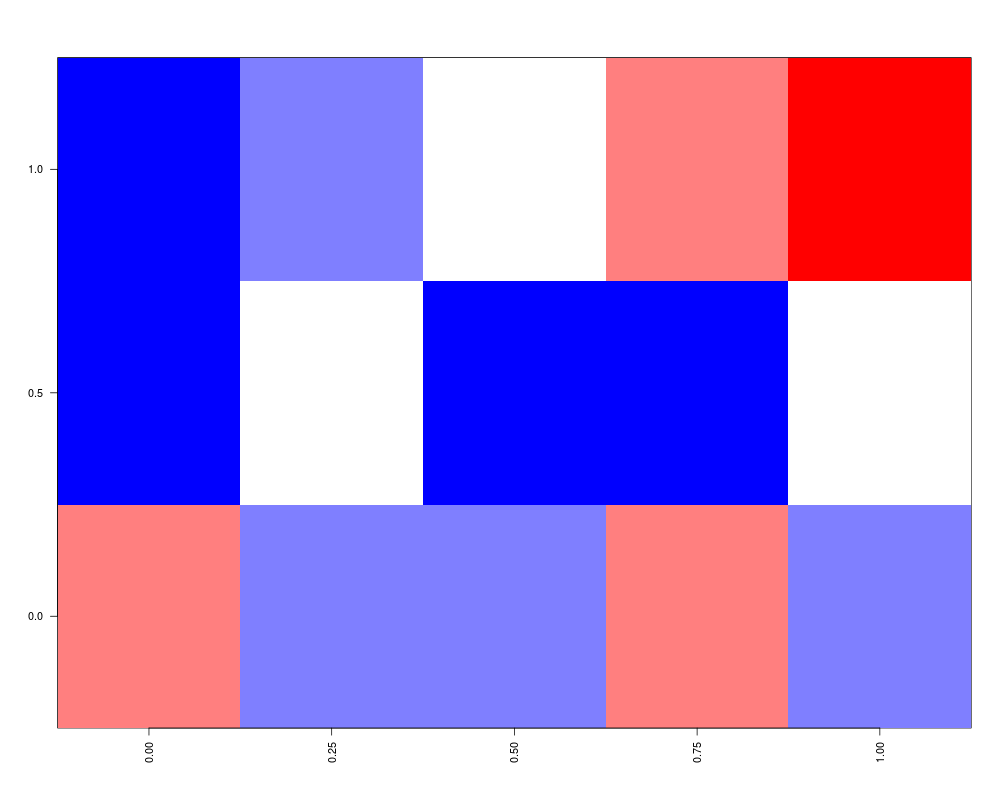
Visualize a matrix with one or two-way color scale.DescriptionFast investigation of matrix objects; standard visualization choices are made automatically; fast and easy-to-use but does not necessarily provide optimal visualization. Usageplot_matrix(mat, type = "twoway", midpoint = 0, palette = NULL, colors = NULL, col.breaks = NULL, interval = 0.1, plot_axes = "both", row.tick = 1, col.tick = 1, cex.xlab = 0.9, cex.ylab = 0.9, xlab = NULL, ylab = NULL, limit.trunc = 0, mar = c(5, 4, 4, 2), ...) Arguments
ValueA list with the color palette (colors), color breakpoints (breaks), and palette function (palette.function) Author(s)Leo Lahti microbiome-admin@googlegroups.com ReferencesSee citation('microbiome') Examplesmat <- rbind(c(1,2,3,4,5), c(1, 3, 1), c(4,2,2)) plot_matrix(mat, 'twoway', midpoint = 3) Results
R version 3.3.1 (2016-06-21) -- "Bug in Your Hair"
Copyright (C) 2016 The R Foundation for Statistical Computing
Platform: x86_64-pc-linux-gnu (64-bit)

R is free software and comes with ABSOLUTELY NO WARRANTY.
You are welcome to redistribute it under certain conditions.
Type 'license()' or 'licence()' for distribution details.

R is a collaborative project with many contributors.
Type 'contributors()' for more information and
'citation()' on how to cite R or R packages in publications.

Type 'demo()' for some demos, 'help()' for on-line help, or
'help.start()' for an HTML browser interface to help.
Type 'q()' to quit R.

> library(netresponse)
Loading required package: Rgraphviz
Loading required package: graph
Loading required package: BiocGenerics
Loading required package: parallel

Attaching package: 'BiocGenerics'

The following objects are masked from 'package:parallel':

    clusterApply, clusterApplyLB, clusterCall, clusterEvalQ,
    clusterExport, clusterMap, parApply, parCapply, parLapply,
    parLapplyLB, parRapply, parSapply, parSapplyLB

The following objects are masked from 'package:stats':

    IQR, mad, xtabs

The following objects are masked from 'package:base':

    Filter, Find, Map, Position, Reduce, anyDuplicated, append,
    as.data.frame, cbind, colnames, do.call, duplicated, eval, evalq,
    get, grep, grepl, intersect, is.unsorted, lapply, lengths, mapply,
    match, mget, order, paste, pmax, pmax.int, pmin, pmin.int, rank,
    rbind, rownames, sapply, setdiff, sort, table, tapply, union,
    unique, unsplit

Loading required package: grid
Loading required package: minet
Loading required package: mclust
Package 'mclust' version 5.2
Type 'citation("mclust")' for citing this R package in publications.
Loading required package: reshape2

netresponse (C) 2008-2016 Leo Lahti et al.

https://github.com/antagomir/netresponse
> png(filename="/home/ddbj/snapshot/RGM3/R_BC/result/netresponse/plot_matrix.Rd_%03d_medium.png", width=480, height=480)
> ### Name: plot_matrix
> ### Title: Visualize a matrix with one or two-way color scale.
> ### Aliases: plot_matrix
> ### Keywords: utilities
>
> ### ** Examples
>
>   mat <- rbind(c(1,2,3,4,5), c(1, 3, 1), c(4,2,2))
Warning message:
In .Method(..., deparse.level = deparse.level) :
  number of columns of result is not a multiple of vector length (arg 2)
>   plot_matrix(mat, 'twoway', midpoint = 3)
$colors
 [1] "#0000FF" "#0C0CFF" "#1919FF" "#2626FF" "#3333FF" "#3F3FFF" "#4C4CFF"
 [8] "#5959FF" "#6666FF" "#7272FF" "#7F7FFF" "#8C8CFF" "#9999FF" "#A5A5FF"
[15] "#B2B2FF" "#BFBFFF" "#CCCCFF" "#D8D8FF" "#E5E5FF" "#F2F2FF" "#FFFFFF"
[22] "#FFF2F2" "#FFE5E5" "#FFD8D8" "#FFCBCB" "#FFBFBF" "#FFB2B2" "#FFA5A5"
[29] "#FF9898" "#FF8C8C" "#FF7F7F" "#FF7272" "#FF6565" "#FF5959" "#FF4C4C"
[36] "#FF3F3F" "#FF3232" "#FF2626" "#FF1919" "#FF0C0C" "#FF0000"

$breaks
 [1] -999998.90       1.05       1.15       1.25       1.35       1.45
 [7]       1.55       1.65       1.75       1.85       1.95       2.05
[13]       2.15       2.25       2.35       2.45       2.55       2.65
[19]       2.75       2.85       2.95       3.05       3.15       3.25
[25]       3.35       3.45       3.55       3.65       3.75       3.85
[31]       3.95       4.05       4.15       4.25       4.35       4.45
[37]       4.55       4.65       4.75       4.85       4.95 1000004.90

$palette.function
function (n)
{
    x <- ramp(seq.int(0, 1, length.out = n))
    if (ncol(x) == 4L)
        rgb(x[, 1L], x[, 2L], x[, 3L], x[, 4L], maxColorValue = 255)
    else rgb(x[, 1L], x[, 2L], x[, 3L], maxColorValue = 255)
}
<bytecode: 0x7203a18>
<environment: 0x72047d8>

>
>
>
>
>
> dev.off()
null device
          1
>
|