Supported by Dr. Osamu Ogasawara and  . . |
|
Last data update: 2014.03.03 |
Compares the distribution of several vectors at a time using either boxplots or density curvesDescriptionThis function was concieved to easily compare several normalization methods in terms of variability of log-ratios, M. Basically it produces two plots: The first is a the density plot of the several matrices passed as arguments, while the second is a box plot. Median of absolute deviations for each method is printed on screen. UsagecompNorm(x,...,bw="AUTO",xlim=c(-3,3),titles="AUTO",type="d") Arguments
DetailsThis function is used to compare the normalized log ratios M obtained with several normalization methods. ValueNULL, this function only displays charts and prints on the screen some statistics. Author(s)Tarca, A.L. ReferencesA. L. Tarca, J. E. K. Cooke, and J. Mackay. Robust neural networks approach for spatial and
intensity dependent normalization of cDNA data. Bioinformatics. 2004,submitted. See Also
Examples
# Normalize swirl data with two methods
data(swirl)
swirlNN<-maNormNN(swirl[,1])
swirlLoess<-maNormMain(swirl[,1])
nms<-c("None","Loess","NNets")
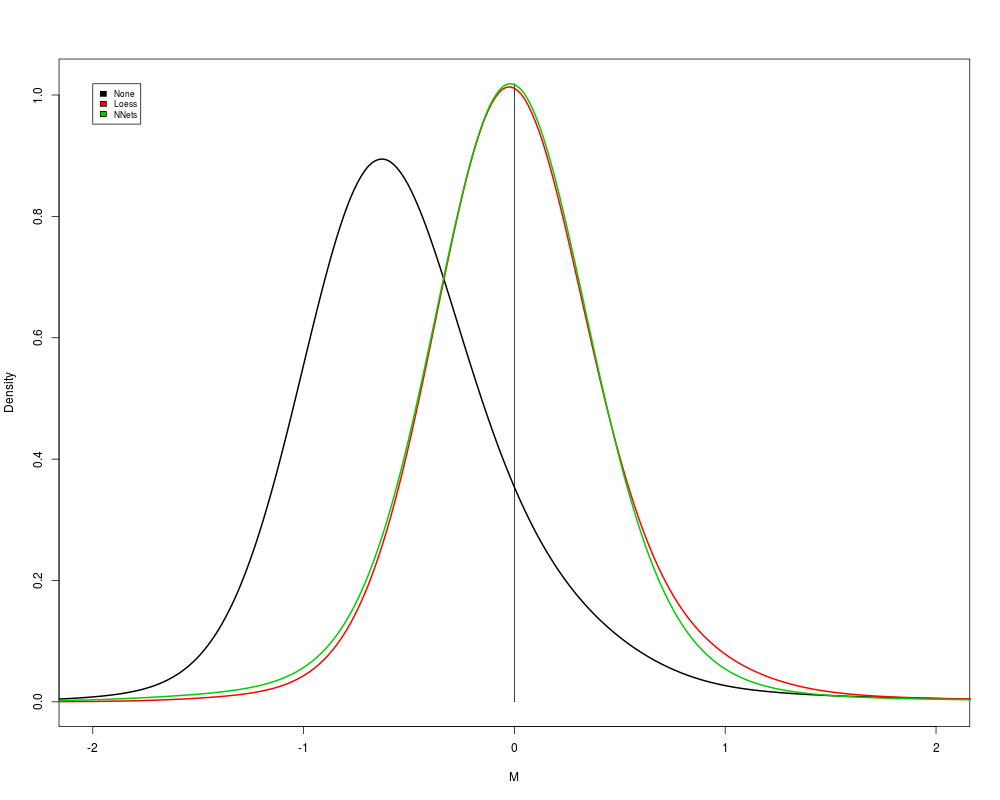
#compare distributions: density plot
compNorm(as.vector(maM(swirl[,1])),as.vector(maM(swirlLoess)),as.vector(maM(swirlNN)),xlim=c(- 2,2),bw="AUTO",titles=nms,type="d")
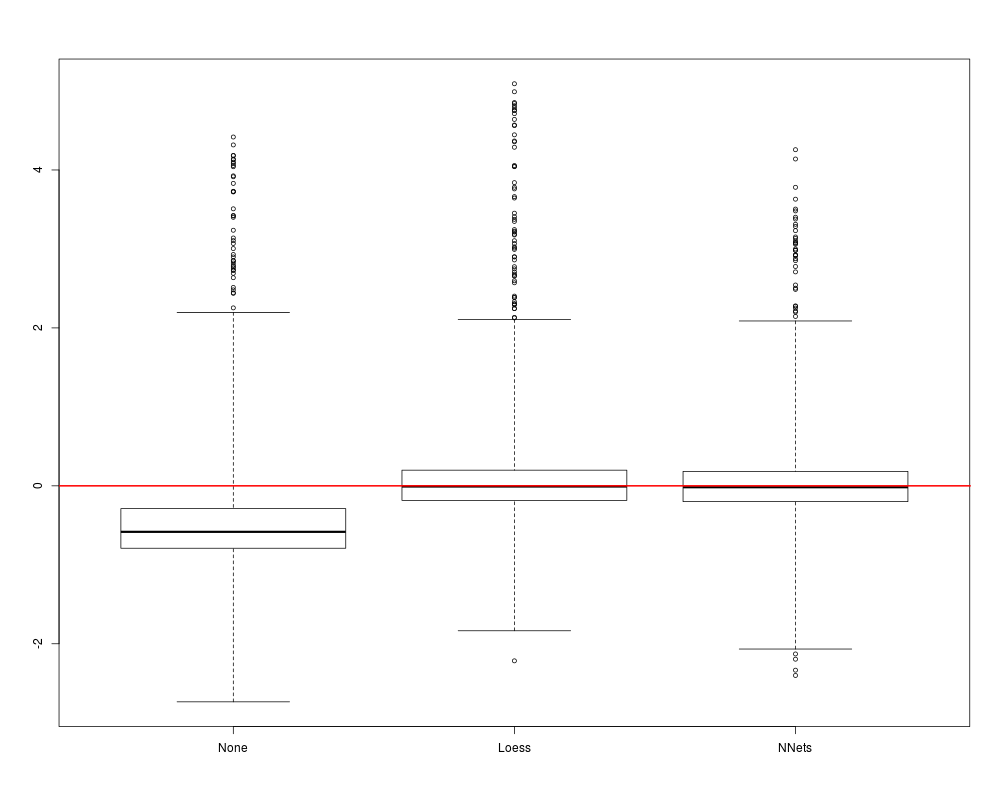
#compare distributions: box plot
compNorm(as.vector(maM(swirl[,1])),as.vector(maM(swirlLoess)),as.vector(maM(swirlNN)),xlim=c(- 2,2),bw="AUTO",titles=nms,type="b")
Results
R version 3.3.1 (2016-06-21) -- "Bug in Your Hair"
Copyright (C) 2016 The R Foundation for Statistical Computing
Platform: x86_64-pc-linux-gnu (64-bit)

R is free software and comes with ABSOLUTELY NO WARRANTY.
You are welcome to redistribute it under certain conditions.
Type 'license()' or 'licence()' for distribution details.

R is a collaborative project with many contributors.
Type 'contributors()' for more information and
'citation()' on how to cite R or R packages in publications.

Type 'demo()' for some demos, 'help()' for on-line help, or
'help.start()' for an HTML browser interface to help.
Type 'q()' to quit R.

> library(nnNorm)
Loading required package: marray
Loading required package: limma
> png(filename="/home/ddbj/snapshot/RGM3/R_BC/result/nnNorm/compNorm.Rd_%03d_medium.png", width=480, height=480)
> ### Name: compNorm
> ### Title: Compares the distribution of several vectors at a time using
> ###   either boxplots or density curves
> ### Aliases: compNorm
> ### Keywords: univar
>
> ### ** Examples
>
>  # Normalize swirl data with two methods
>  data(swirl)
>  swirlNN<-maNormNN(swirl[,1])

Processing array 1 of 1
****************>  swirlLoess<-maNormMain(swirl[,1])
>  nms<-c("None","Loess","NNets")
>  #compare distributions: density plot
>  compNorm(as.vector(maM(swirl[,1])),as.vector(maM(swirlLoess)),as.vector(maM(swirlNN)),xlim=c(- 2,2),bw="AUTO",titles=nms,type="d")
MAD  None : 0.359725
MAD  Loess : 0.2804819
MAD  NNets : 0.2837382
>  #compare distributions: box plot
>  compNorm(as.vector(maM(swirl[,1])),as.vector(maM(swirlLoess)),as.vector(maM(swirlNN)),xlim=c(- 2,2),bw="AUTO",titles=nms,type="b")
MAD  None : 0.359725
MAD  Loess : 0.2804819
MAD  NNets : 0.2837382
>
>
>
>
>
>
> dev.off()
null device
          1
>
|