Supported by Dr. Osamu Ogasawara and  . . |
|
Last data update: 2014.03.03 |
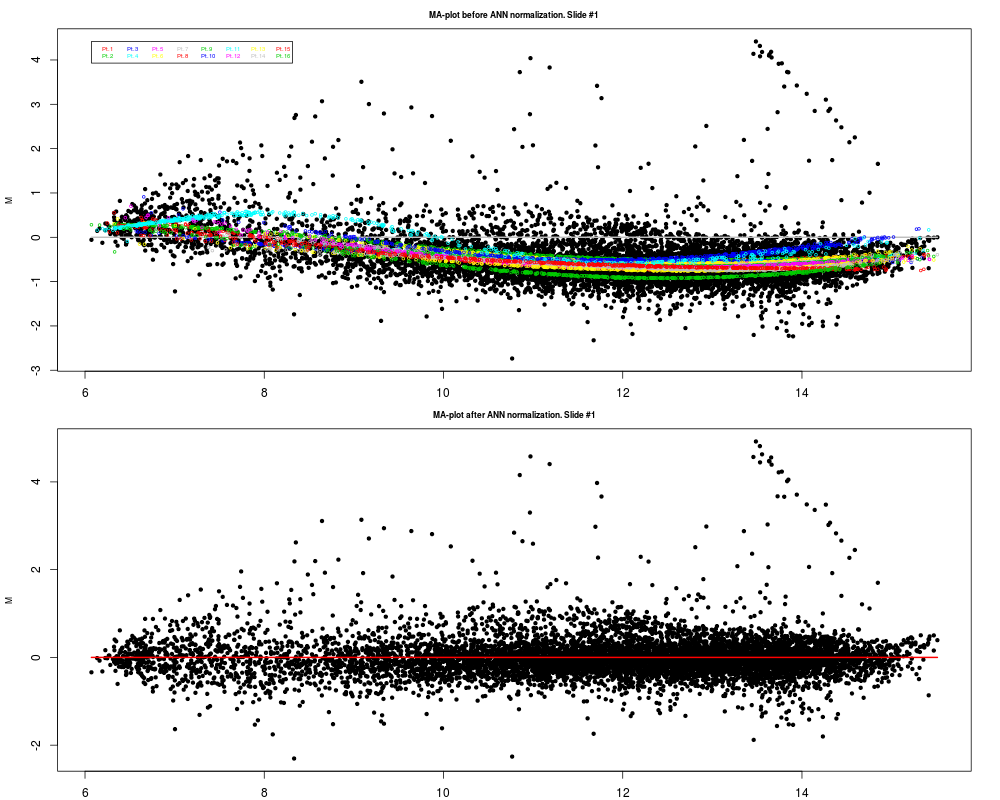
Intensity and spatial normalization using robust neural networks fittingDescriptionThis function normalizes a batch of cDNA arrays by removing the intensity and spatial dependent bias. UsagemaNormNN(mbatch,w=NULL,binWidth=3,binHeight=3,model.nonlins=3,iterations=100,nFolds=10,maplots=FALSE,verbose=FALSE) Arguments
DetailsThis function uses neural networks to model the bias in cDNA data sets. ValueA Author(s)Tarca, A.L. ReferencesA. L. Tarca, J. E. K. Cooke, and J. Mackay. Robust neural networks approach for spatial and
intensity dependent normalization of cDNA data. Bioinformatics. 2004,submitted. See Also
Examples# Normalization of swirl data data(swirl) # print-tip, intensity and spatial normalization of the first slide in swirl data set swirlNN<-maNormNN(swirl[,1]) #do not consider spatial variations, and display M-A plots before and after normalization swirlNN<-maNormNN(swirl[,1],binWidth=maNsc(swirl),binHeight=maNsr(swirl),maplots=TRUE) Results
R version 3.3.1 (2016-06-21) -- "Bug in Your Hair"
Copyright (C) 2016 The R Foundation for Statistical Computing
Platform: x86_64-pc-linux-gnu (64-bit)

R is free software and comes with ABSOLUTELY NO WARRANTY.
You are welcome to redistribute it under certain conditions.
Type 'license()' or 'licence()' for distribution details.

R is a collaborative project with many contributors.
Type 'contributors()' for more information and
'citation()' on how to cite R or R packages in publications.

Type 'demo()' for some demos, 'help()' for on-line help, or
'help.start()' for an HTML browser interface to help.
Type 'q()' to quit R.

> library(nnNorm)
Loading required package: marray
Loading required package: limma
> png(filename="/home/ddbj/snapshot/RGM3/R_BC/result/nnNorm/maNormNN.Rd_%03d_medium.png", width=480, height=480)
> ### Name: maNormNN
> ### Title: Intensity and spatial normalization using robust neural networks
> ###   fitting
> ### Aliases: maNormNN
> ### Keywords: smooth robust
>
> ### ** Examples
>
> # Normalization of swirl data
> data(swirl)
> # print-tip, intensity and spatial normalization of the first slide in swirl data set
> swirlNN<-maNormNN(swirl[,1])

Processing array 1 of 1
****************>
> #do not consider spatial variations, and display M-A plots before and after normalization
> swirlNN<-maNormNN(swirl[,1],binWidth=maNsc(swirl),binHeight=maNsr(swirl),maplots=TRUE)
binWidth being too large or NULL, the space coordinate X was not used in normalization
binHeight being too large or NULL, the space coordinate Y was not used in normalization

Processing array 1 of 1
****************>
>
>
>
>
>
> dev.off()
null device
          1
>
|