Supported by Dr. Osamu Ogasawara and  . . |
|
Last data update: 2014.03.03 |
Coverage calculation and normalization to reads per million (rpm)DescriptionCalculates the coverage values from a Usagecoverage.rpm(data, scale=1e6, ...) Arguments
Value
Author(s)Oscar Flores oflores@mmb.pcb.ub.es See Also
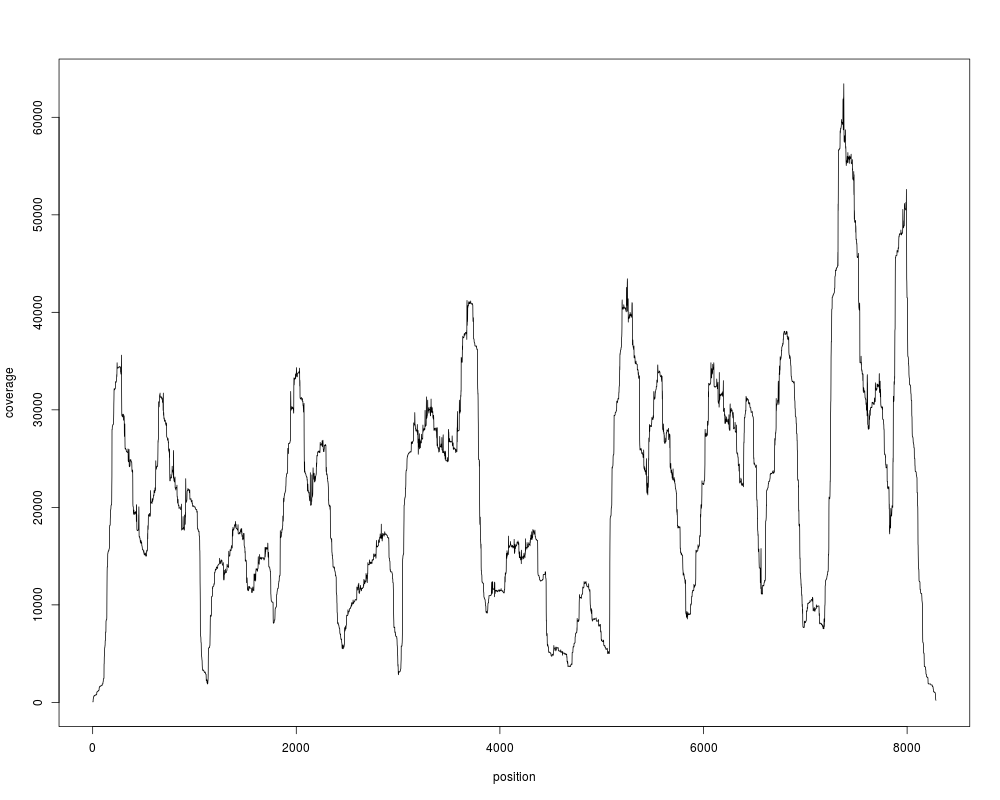
Examples#Load the example dataset and get the coverage data(nucleosome_htseq) cov = coverage.rpm(nucleosome_htseq) print(cov) #Plot it plot(as.vector(cov[["chr1"]]), type="l", ylab="coverage", xlab="position") Results
R version 3.3.1 (2016-06-21) -- "Bug in Your Hair"
Copyright (C) 2016 The R Foundation for Statistical Computing
Platform: x86_64-pc-linux-gnu (64-bit)

R is free software and comes with ABSOLUTELY NO WARRANTY.
You are welcome to redistribute it under certain conditions.
Type 'license()' or 'licence()' for distribution details.

R is a collaborative project with many contributors.
Type 'contributors()' for more information and
'citation()' on how to cite R or R packages in publications.

Type 'demo()' for some demos, 'help()' for on-line help, or
'help.start()' for an HTML browser interface to help.
Type 'q()' to quit R.

> library(nucleR)
Loading required package: ShortRead
Loading required package: BiocGenerics
Loading required package: parallel

Attaching package: 'BiocGenerics'

The following objects are masked from 'package:parallel':

    clusterApply, clusterApplyLB, clusterCall, clusterEvalQ,
    clusterExport, clusterMap, parApply, parCapply, parLapply,
    parLapplyLB, parRapply, parSapply, parSapplyLB

The following objects are masked from 'package:stats':

    IQR, mad, xtabs

The following objects are masked from 'package:base':

    Filter, Find, Map, Position, Reduce, anyDuplicated, append,
    as.data.frame, cbind, colnames, do.call, duplicated, eval, evalq,
    get, grep, grepl, intersect, is.unsorted, lapply, lengths, mapply,
    match, mget, order, paste, pmax, pmax.int, pmin, pmin.int, rank,
    rbind, rownames, sapply, setdiff, sort, table, tapply, union,
    unique, unsplit

Loading required package: BiocParallel
Loading required package: Biostrings
Loading required package: S4Vectors
Loading required package: stats4

Attaching package: 'S4Vectors'

The following objects are masked from 'package:base':

    colMeans, colSums, expand.grid, rowMeans, rowSums

Loading required package: IRanges
Loading required package: XVector
Loading required package: Rsamtools
Loading required package: GenomeInfoDb
Loading required package: GenomicRanges
Loading required package: GenomicAlignments
Loading required package: SummarizedExperiment
Loading required package: Biobase
Welcome to Bioconductor

    Vignettes contain introductory material; view with
    'browseVignettes()'. To cite Bioconductor, see
    'citation("Biobase")', and for packages 'citation("pkgname")'.

> png(filename="/home/ddbj/snapshot/RGM3/R_BC/result/nucleR/coverage.rpm.Rd_%03d_medium.png", width=480, height=480)
> ### Name: coverage.rpm
> ### Title: Coverage calculation and normalization to reads per million
> ###   (rpm)
> ### Aliases: coverage.rpm
> ### Keywords: manip
>
> ### ** Examples
>
>
> 	#Load the example dataset and get the coverage
> 	data(nucleosome_htseq)
> 	cov = coverage.rpm(nucleosome_htseq)
>
> 	print(cov)
RleList of length 1
$chr1
numeric-Rle of length 8284 with 4589 runs
  Lengths:                4                1 ...                3
  Values : 55.5524693072607 277.762346536304 ... 222.209877229043

>
> 	#Plot it
> 	plot(as.vector(cov[["chr1"]]), type="l", ylab="coverage", xlab="position")
>
>
>
>
>
> dev.off()
null device
          1
>
|
Created & Maintained by Osamu Ogasawara (osamu.ogasawara@gmail.com) and 