Supported by Dr. Osamu Ogasawara and  . . |
|
Last data update: 2014.03.03 |
Auto detection of a fitted
|
data |
Numeric vector to be filtered |
pc.min, pc.max |
Range of allowed values for pcKeepComp (minimum and maximum), in the range 0:1. |
max.iter |
Maximum number of iterations |
verbose |
Extra information (debug) |
cor.target |
Target correlation between the filtered and the original profiles. A value around 0.99 is recommeded for Next Generation Sequencing data and around 0.7 for Tiling Arrays. |
cor.tol |
Tolerance allowed between the obtained correlation an the target one. |
smpl.num |
If |
smpl.min.size, smpl.max.size |
Minimum and maximum size of the samples. This is used for selection and sub-selection of ranges with meaningful values (i,e, different from 0 and NA). Power of 2 values are recommended, despite non-mandatory. |
... |
Parameters to be pass to |
Details
This function predicts a suitable pcKeepComp value for filterFFT function. This is the recommended amount of components (in percentage) to keep in the filterFFT function to obtain a correlation of (or near of) cor.target.
The search starts from two given values pc.min, pc.max and uses linial interpolation to quickly reach a value that gives a corelation between the filtered and the original near cor.target within the specified tolerance cor.tol.
To allow a quick detection without an exhaustive search, this function uses a subset of the data by randomly sampling those regions with meaningful coverage values (i,e, different from 0 or NA) larger than smpl.min.size. If it's not possible to obtain smpl.max.size from this region (this could be due to flanking 0's, for example) at least smpl.min.size will be used to check correlation. Mean correlation between all sampled regions is used to test the performance of the pcKeepComp parameter.
If the number of meaningful bases in data is less than smpl.min.size * (smpl.num/2) all the data vector will be used instead of using sampling.
Value
Fitted pcKeepComp value
Author(s)
Oscar Flores oflores@mmb.pcb.ub.es, David Rosell david.rosell@irbbarcelona.org
Examples
#Load dataset
data(nucleosome_htseq)
data = as.vector(coverage.rpm(nucleosome_htseq)[[1]])
#Get recommended pcKeepComp value
pckeepcomp = pcKeepCompDetect(data, cor.target=0.99)
print(pckeepcomp)
#call filterFFT
f1 = filterFFT(data, pcKeepComp=pckeepcomp)
#Also this can be called directly
f2 = filterFFT(data, pcKeepComp="auto", cor.target=0.99)
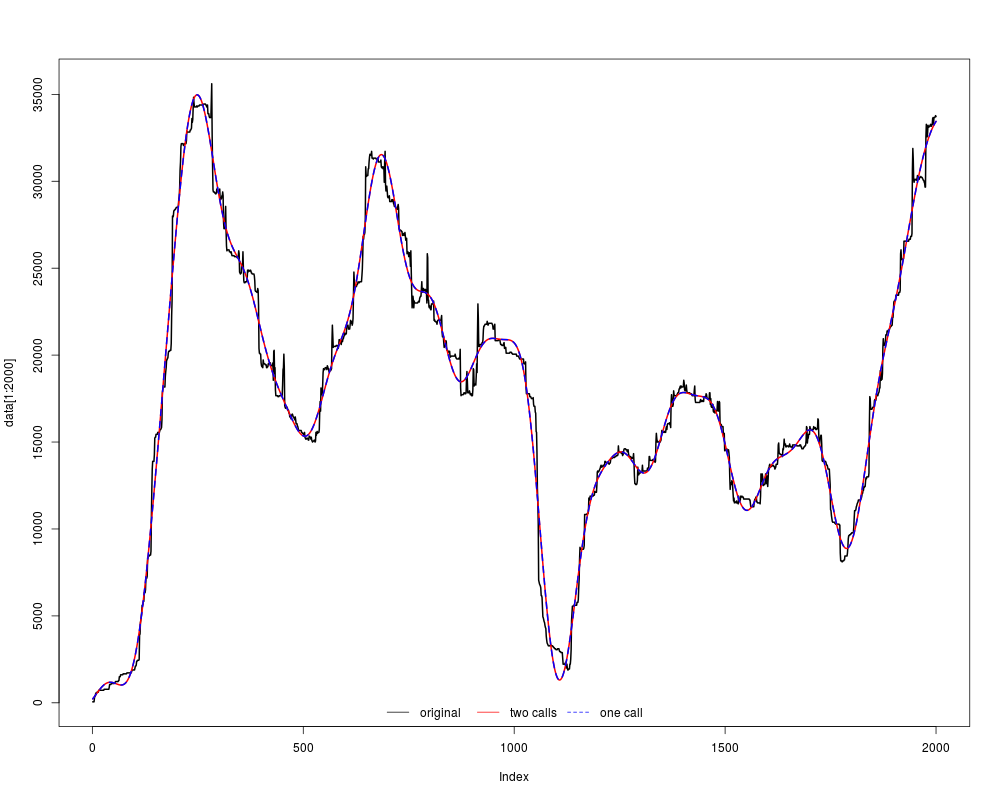
#Plot
plot(data[1:2000], col="black", type="l", lwd=2)
lines(f1[1:2000], col="red", lwd=2)
lines(f2[1:2000], col="blue", lwd=2, lty=2)
legend("bottom", c("original", "two calls", "one call"), col=c("black", "red", "blue"), lty=c(1,1,2), horiz=TRUE, bty="n")
Results
R version 3.3.1 (2016-06-21) -- "Bug in Your Hair"
Copyright (C) 2016 The R Foundation for Statistical Computing
Platform: x86_64-pc-linux-gnu (64-bit)

R is free software and comes with ABSOLUTELY NO WARRANTY.
You are welcome to redistribute it under certain conditions.
Type 'license()' or 'licence()' for distribution details.

R is a collaborative project with many contributors.
Type 'contributors()' for more information and
'citation()' on how to cite R or R packages in publications.

Type 'demo()' for some demos, 'help()' for on-line help, or
'help.start()' for an HTML browser interface to help.
Type 'q()' to quit R.

> library(nucleR)
Loading required package: ShortRead
Loading required package: BiocGenerics
Loading required package: parallel

Attaching package: 'BiocGenerics'

The following objects are masked from 'package:parallel':

    clusterApply, clusterApplyLB, clusterCall, clusterEvalQ,
    clusterExport, clusterMap, parApply, parCapply, parLapply,
    parLapplyLB, parRapply, parSapply, parSapplyLB

The following objects are masked from 'package:stats':

    IQR, mad, xtabs

The following objects are masked from 'package:base':

    Filter, Find, Map, Position, Reduce, anyDuplicated, append,
    as.data.frame, cbind, colnames, do.call, duplicated, eval, evalq,
    get, grep, grepl, intersect, is.unsorted, lapply, lengths, mapply,
    match, mget, order, paste, pmax, pmax.int, pmin, pmin.int, rank,
    rbind, rownames, sapply, setdiff, sort, table, tapply, union,
    unique, unsplit

Loading required package: BiocParallel
Loading required package: Biostrings
Loading required package: S4Vectors
Loading required package: stats4

Attaching package: 'S4Vectors'

The following objects are masked from 'package:base':

    colMeans, colSums, expand.grid, rowMeans, rowSums

Loading required package: IRanges
Loading required package: XVector
Loading required package: Rsamtools
Loading required package: GenomeInfoDb
Loading required package: GenomicRanges
Loading required package: GenomicAlignments
Loading required package: SummarizedExperiment
Loading required package: Biobase
Welcome to Bioconductor

    Vignettes contain introductory material; view with
    'browseVignettes()'. To cite Bioconductor, see
    'citation("Biobase")', and for packages 'citation("pkgname")'.

> png(filename="/home/ddbj/snapshot/RGM3/R_BC/result/nucleR/pcKeepCompDetect.Rd_%03d_medium.png", width=480, height=480)
> ### Name: pcKeepCompDetect
> ### Title: Auto detection of a fitted 'pcKeepComp' param for filterFFT
> ###   function
> ### Aliases: pcKeepCompDetect
> ### Keywords: attribute
>
> ### ** Examples
>
>
> 	#Load dataset
> 	data(nucleosome_htseq)
> 	data = as.vector(coverage.rpm(nucleosome_htseq)[[1]])
>
> 	#Get recommended pcKeepComp value
> 	pckeepcomp = pcKeepCompDetect(data, cor.target=0.99)
> 	print(pckeepcomp)
[1] 0.01
>
> 	#call filterFFT
> 	f1 = filterFFT(data, pcKeepComp=pckeepcomp)
>
> 	#Also this can be called directly
> 	f2 = filterFFT(data, pcKeepComp="auto", cor.target=0.99)
>
> 	#Plot
> 	plot(data[1:2000], col="black", type="l", lwd=2)
> 	lines(f1[1:2000], col="red", lwd=2)
> 	lines(f2[1:2000], col="blue", lwd=2, lty=2)
> 	legend("bottom", c("original", "two calls", "one call"), col=c("black", "red", "blue"), lty=c(1,1,2), horiz=TRUE, bty="n")
>
>
>
>
>
> dev.off()
null device
          1
>
|