Supported by Dr. Osamu Ogasawara and  . . |
|
Last data update: 2014.03.03 |
Detect peaks (local maximum) from values seriesDescriptionThis function allows a efficient recognition of the local maximums (peaks) in a given numeric vector. It's recommended to smooth the input with Usage## S4 method for signature 'list' peakDetection(data, threshold="25%", width=1, score=TRUE, mc.cores=1) ## S4 method for signature 'numeric' peakDetection(data, threshold="25%", width=1, score=TRUE, mc.cores=1) Arguments
ValueThe type of the return depends on the input parameters:
NoteIf Author(s)Oscar Flores oflores@mmb.pcb.ub.es See Also
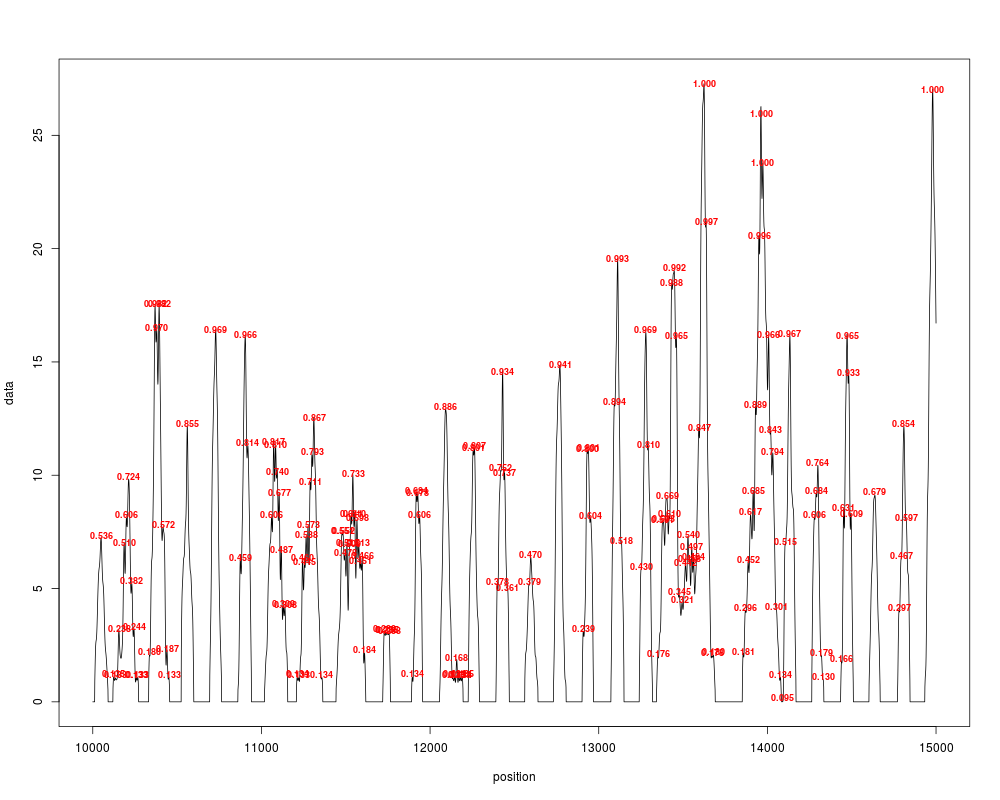
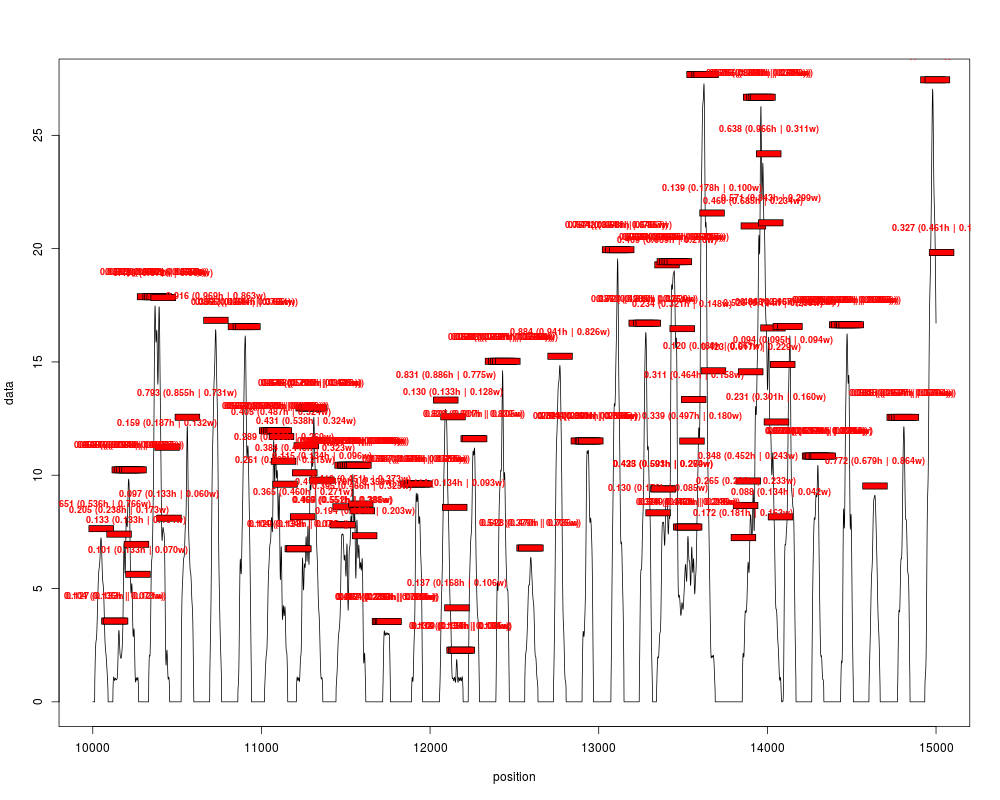
Examples#Generate a random peaks profile reads = syntheticNucMap(nuc.len=40, lin.len=130)$syn.reads cover = coverage(reads) #Filter them cover_fft = filterFFT(cover) #Detect and plot peaks (up a bit the threshold for accounting synthetic data) peaks = peakDetection(cover_fft, threshold="40%", score=TRUE) plotPeaks(peaks, cover_fft, threshold="40%", start=10000, end=15000) #Now use ranges version, which accounts for fuzziness when scoring peaks = peakDetection(cover_fft, threshold="40%", score=TRUE, width=147) plotPeaks(peaks, cover_fft, threshold="40%", start=10000, end=15000) Results
R version 3.3.1 (2016-06-21) -- "Bug in Your Hair"
Copyright (C) 2016 The R Foundation for Statistical Computing
Platform: x86_64-pc-linux-gnu (64-bit)

R is free software and comes with ABSOLUTELY NO WARRANTY.
You are welcome to redistribute it under certain conditions.
Type 'license()' or 'licence()' for distribution details.

R is a collaborative project with many contributors.
Type 'contributors()' for more information and
'citation()' on how to cite R or R packages in publications.

Type 'demo()' for some demos, 'help()' for on-line help, or
'help.start()' for an HTML browser interface to help.
Type 'q()' to quit R.

> library(nucleR)
Loading required package: ShortRead
Loading required package: BiocGenerics
Loading required package: parallel

Attaching package: 'BiocGenerics'

The following objects are masked from 'package:parallel':

    clusterApply, clusterApplyLB, clusterCall, clusterEvalQ,
    clusterExport, clusterMap, parApply, parCapply, parLapply,
    parLapplyLB, parRapply, parSapply, parSapplyLB

The following objects are masked from 'package:stats':

    IQR, mad, xtabs

The following objects are masked from 'package:base':

    Filter, Find, Map, Position, Reduce, anyDuplicated, append,
    as.data.frame, cbind, colnames, do.call, duplicated, eval, evalq,
    get, grep, grepl, intersect, is.unsorted, lapply, lengths, mapply,
    match, mget, order, paste, pmax, pmax.int, pmin, pmin.int, rank,
    rbind, rownames, sapply, setdiff, sort, table, tapply, union,
    unique, unsplit

Loading required package: BiocParallel
Loading required package: Biostrings
Loading required package: S4Vectors
Loading required package: stats4

Attaching package: 'S4Vectors'

The following objects are masked from 'package:base':

    colMeans, colSums, expand.grid, rowMeans, rowSums

Loading required package: IRanges
Loading required package: XVector
Loading required package: Rsamtools
Loading required package: GenomeInfoDb
Loading required package: GenomicRanges
Loading required package: GenomicAlignments
Loading required package: SummarizedExperiment
Loading required package: Biobase
Welcome to Bioconductor

    Vignettes contain introductory material; view with
    'browseVignettes()'. To cite Bioconductor, see
    'citation("Biobase")', and for packages 'citation("pkgname")'.

> png(filename="/home/ddbj/snapshot/RGM3/R_BC/result/nucleR/peakDetection.Rd_%03d_medium.png", width=480, height=480)
> ### Name: peakDetection
> ### Title: Detect peaks (local maximum) from values series
> ### Aliases: peakDetection peakDetection,list-method
> ###   peakDetection,numeric-method
> ### Keywords: manip
>
> ### ** Examples
>
>
> 	#Generate a random peaks profile
> 	reads = syntheticNucMap(nuc.len=40, lin.len=130)$syn.reads
> 	cover = coverage(reads)
>
> 	#Filter them
> 	cover_fft = filterFFT(cover)
>
> 	#Detect and plot peaks (up a bit the threshold for accounting synthetic data)
> 	peaks = peakDetection(cover_fft, threshold="40%", score=TRUE)
> 	plotPeaks(peaks, cover_fft, threshold="40%", start=10000, end=15000)
>
> 	#Now use ranges version, which accounts for fuzziness when scoring
>   peaks = peakDetection(cover_fft, threshold="40%", score=TRUE, width=147)
>   plotPeaks(peaks, cover_fft, threshold="40%", start=10000, end=15000)
>
>
>
>
>
> dev.off()
null device
          1
>
|