Supported by Dr. Osamu Ogasawara and  . . |
|
Last data update: 2014.03.03 |
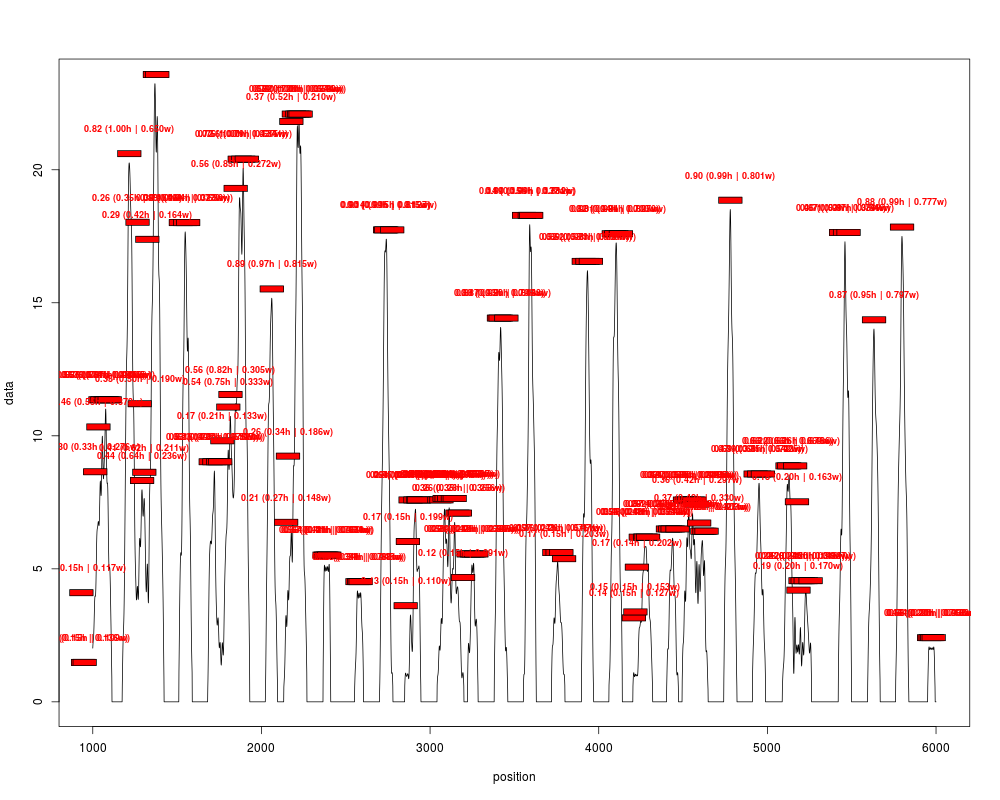
Nucleosome calling plot functionDescriptionHelper function for a quick and convenient overview of nucleosome calling data. This function is intended to plot data previously processed with Usage
plotPeaks(peaks, data, ...)
## S4 method for signature 'IRanges'
plotPeaks(peaks, data, threshold=0, scores=NULL, start=1,
		end=length(data),dyn.pos=TRUE, xlab="position", type="l", col.points="red",
		thr.lty=1,	thr.lwd="1", thr.col="darkred", rect.thick=2, rect.lwd=1,
		rect.border="black", scor.col=col.points, scor.font=2, scor.adj=c(0.5,0),
		scor.cex=0.75, scor.digits=2, indiv.scores=TRUE, ...)
## S4 method for signature 'numeric'
plotPeaks(peaks, data, threshold=0, scores=NULL, start=1,
    end=length(data), xlab="position", type="l", col.points="red",
    thr.lty=1,  thr.lwd="1", thr.col="darkred", scor.col=col.points, scor.font=2,
		scor.adj=c(0.5,0), scor.cex=0.75, scor.digits=2,...)
Arguments
Value(none) Author(s)Oscar Flores oflores@mmb.pcb.ub.es See Also
Examples#Generate a random peaks profile reads = syntheticNucMap(nuc.len=40, lin.len=130)$syn.reads cover = coverage(reads) #Filter them cover_fft = filterFFT(cover) #Detect peaks peaks = peakDetection(cover_fft, threshold="40%", score=TRUE, width=140) #Plot peaks and coverage profile (show only a window) plotPeaks(peaks, cover_fft, threshold="40%", start=1000, end=6000) Results
R version 3.3.1 (2016-06-21) -- "Bug in Your Hair"
Copyright (C) 2016 The R Foundation for Statistical Computing
Platform: x86_64-pc-linux-gnu (64-bit)

R is free software and comes with ABSOLUTELY NO WARRANTY.
You are welcome to redistribute it under certain conditions.
Type 'license()' or 'licence()' for distribution details.

R is a collaborative project with many contributors.
Type 'contributors()' for more information and
'citation()' on how to cite R or R packages in publications.

Type 'demo()' for some demos, 'help()' for on-line help, or
'help.start()' for an HTML browser interface to help.
Type 'q()' to quit R.

> library(nucleR)
Loading required package: ShortRead
Loading required package: BiocGenerics
Loading required package: parallel

Attaching package: 'BiocGenerics'

The following objects are masked from 'package:parallel':

    clusterApply, clusterApplyLB, clusterCall, clusterEvalQ,
    clusterExport, clusterMap, parApply, parCapply, parLapply,
    parLapplyLB, parRapply, parSapply, parSapplyLB

The following objects are masked from 'package:stats':

    IQR, mad, xtabs

The following objects are masked from 'package:base':

    Filter, Find, Map, Position, Reduce, anyDuplicated, append,
    as.data.frame, cbind, colnames, do.call, duplicated, eval, evalq,
    get, grep, grepl, intersect, is.unsorted, lapply, lengths, mapply,
    match, mget, order, paste, pmax, pmax.int, pmin, pmin.int, rank,
    rbind, rownames, sapply, setdiff, sort, table, tapply, union,
    unique, unsplit

Loading required package: BiocParallel
Loading required package: Biostrings
Loading required package: S4Vectors
Loading required package: stats4

Attaching package: 'S4Vectors'

The following objects are masked from 'package:base':

    colMeans, colSums, expand.grid, rowMeans, rowSums

Loading required package: IRanges
Loading required package: XVector
Loading required package: Rsamtools
Loading required package: GenomeInfoDb
Loading required package: GenomicRanges
Loading required package: GenomicAlignments
Loading required package: SummarizedExperiment
Loading required package: Biobase
Welcome to Bioconductor

    Vignettes contain introductory material; view with
    'browseVignettes()'. To cite Bioconductor, see
    'citation("Biobase")', and for packages 'citation("pkgname")'.

> png(filename="/home/ddbj/snapshot/RGM3/R_BC/result/nucleR/plotPeaks.Rd_%03d_medium.png", width=480, height=480)
> ### Name: plotPeaks
> ### Title: Nucleosome calling plot function
> ### Aliases: plotPeaks plotPeaks,numeric-method plotPeaks,data.frame-method
> ###   plotPeaks,RangedData-method plotPeaks,IRanges-method
> ### Keywords: hplot
>
> ### ** Examples
>
>
>   #Generate a random peaks profile
>   reads = syntheticNucMap(nuc.len=40, lin.len=130)$syn.reads
>   cover = coverage(reads)
>
>   #Filter them
>   cover_fft = filterFFT(cover)
>
>   #Detect peaks
>   peaks = peakDetection(cover_fft, threshold="40%", score=TRUE, width=140)
>
> 	#Plot peaks and coverage profile (show only a window)
>   plotPeaks(peaks, cover_fft, threshold="40%", start=1000, end=6000)
>
>
>
>
>
> dev.off()
null device
          1
>
|