This function generates a synthetic nucleosome map using the parameters given by the user and returns the coverage (like NGS experiments) or a pseudo-hybdridization ratio (like Tiling Arrays) toghether with the perfect information about the well positioned and fuzzy nucleosome positions.
Number of well-positioned (non overlapped) nucleosomes. They are placed uniformly every nuc.len+lin.len basepairs.
wp.del
Number of well-positioned nucleosomes (the ones generated by wp.num) to remove. This will create an uncovered region.
wp.var
Maximum variance in basepairs of the well-positioned nucleosomes. This will create some variation in the position of the reads describing the same nucleosome
fuz.num
Number of fuzzy nucleosomes. They are distributed randomly over all the region. They could be overlapped with other well-positioned or fuzzy nucleosomes.
fuz.var
Maximum variance of the fuzzy nucleosomes. This allow to set different variance in well-positioned and fuzzy nucleosome reads (using wp.var and fuz.var)
max.cover
Maximum coverage of a nucleosome, i.e., how many times a nucleosome read can be repeated. The final coverage probably will be higher by the addition of overlapping nucleosomes.
nuc.len
Nucleosome length. It's not recomended change the default 147bp value.
lin.len
Linker DNA length. Usually around 20 bp.
rnd.seed
As this model uses random distributions for the placement, by setting the rnd.seed to a known value allows to reproduce maps in different executions or computers. If you don't need this, just left it in default value.
as.ratio
If as.ratio=TRUE this will create and return a synthetic naked DNA control map and the ratio between it and the nucleosome coverage. This can be used to simulate hybridization ratio data, like the one in Tiling Arrays.
show.plot
If TRUE, will plot the output coverage map, with the nucleosome calls and optionally the calculated ratio.
...
Additional parameters to be passed to plot if show.plot=TRUE
Value
A list with the following elements:
wp.starts
Start points of well-positioned nucleosomes
wp.nreads
Number of repetitions of each well positioned read
wp.reads
Well positioned nucleosome reads (IRanges format), containing the repetitions
fuz.starts
Start points of the fuzzy nucleosomes
fuz.nreads
Number of repetitions of each fuzzy nucleosome read
fuz.reads
Fuzzy nucleosome reads (IRanges format), containing all the repetitions
syn.reads
All synthetic nucleosome reads togheter (IRanges format)
The following elements will be only returned if as.ratio=TRUE:
ctr.reads
The pseudo-naked DNA (control) reads (IRanges format)
syn.ratio
The calculated ratio nucleosomal/control (Rle format)
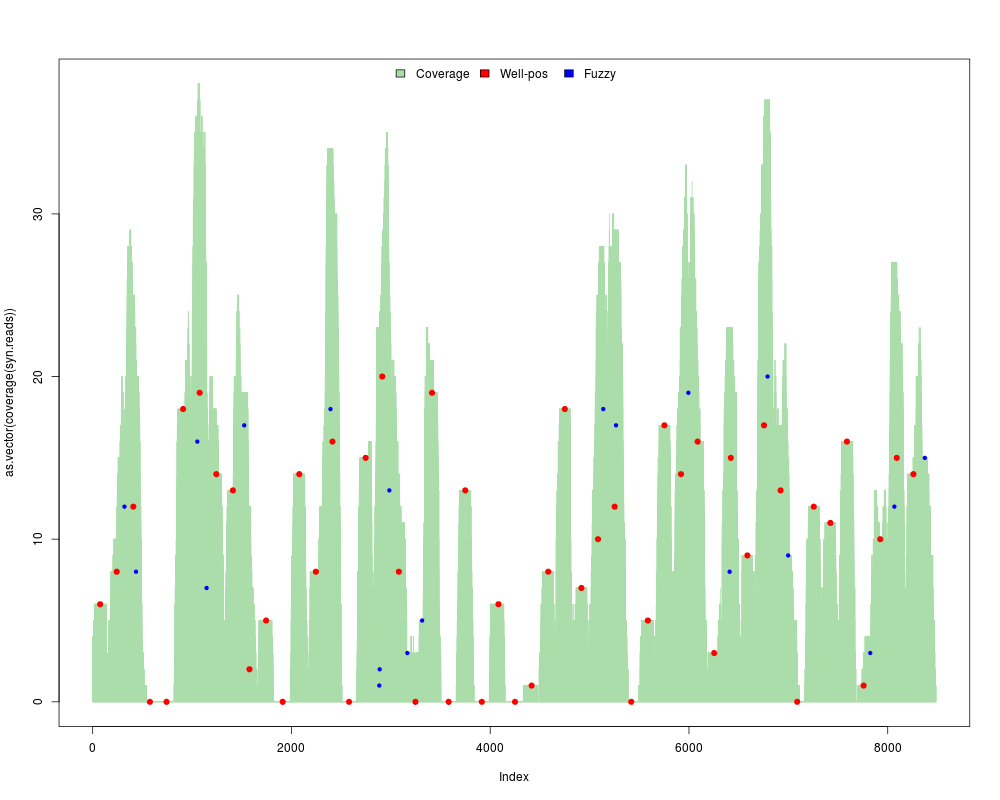
#Generate a synthetic map with 50wp + 20fuzzy nucleosomes using fixed random seed=1
res = syntheticNucMap(wp.num=50, fuz.num=20, show.plot=TRUE, rnd.seed=1)
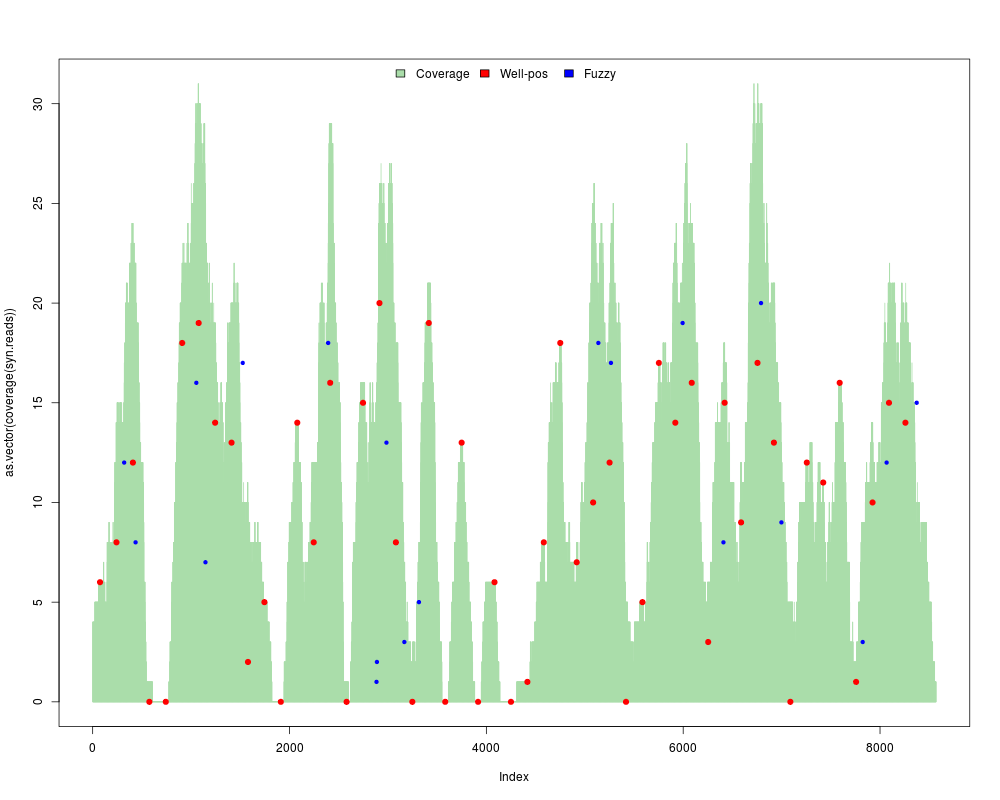
#Increase the fuzzyness
res = syntheticNucMap(wp.num=50, fuz.num=20, wp.var=70, fuz.var=150, show.plot=TRUE, rnd.seed=1)
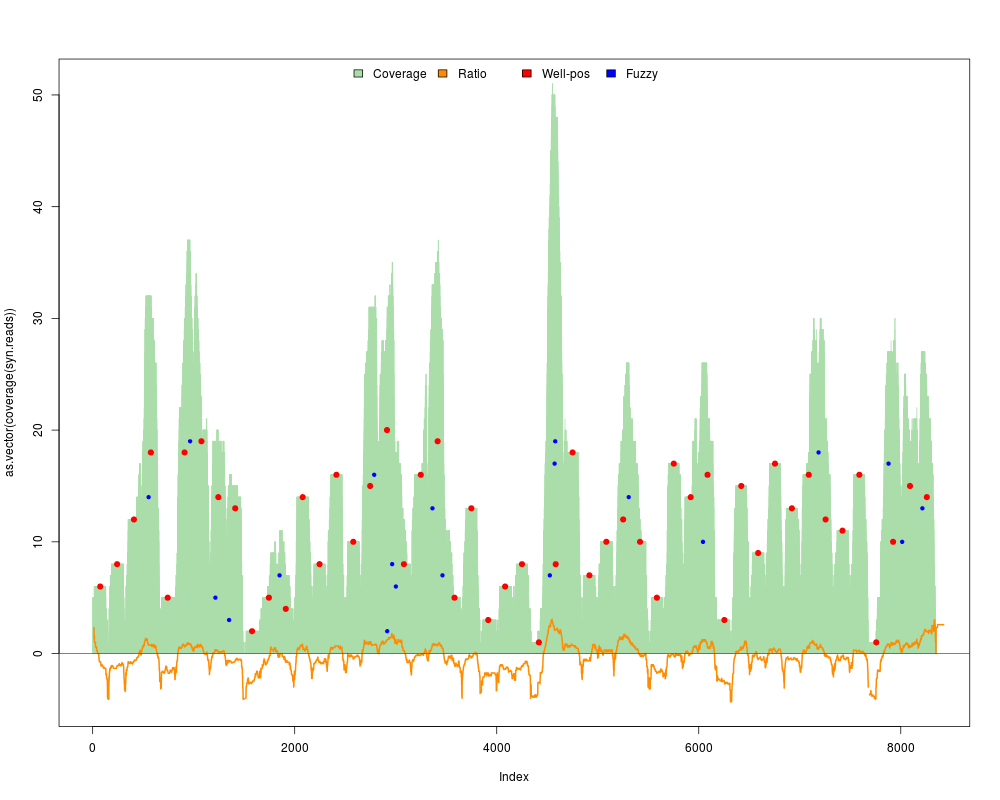
#Calculate also a random map and get the ratio between random and nucleosomal
res = syntheticNucMap(wp.num=50, wp.del=0, fuz.num=20, as.ratio=TRUE, show.plot=TRUE, rnd.seed=1)
print(res)
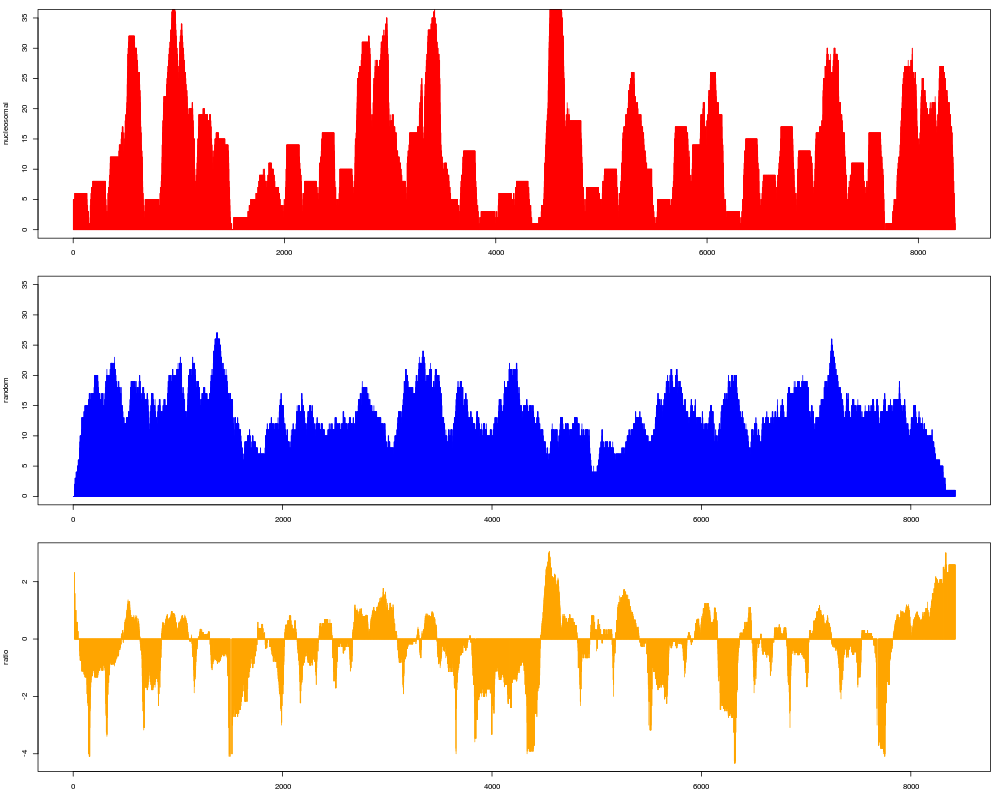
#Different reads can be accessed separately from results
#Let's use this to plot the nucleosomal + the random map
par(mfrow=c(3,1), mar=c(3,4,1,1))
plot(as.vector(coverage(res$syn.reads)), type="h", col="red", ylab="nucleosomal", ylim=c(0,35))
plot(as.vector(coverage(res$ctr.reads)), type="h", col="blue", ylab="random", ylim=c(0,35))
plot(as.vector(res$syn.ratio), type="h", col="orange", ylab="ratio")
Results
R version 3.3.1 (2016-06-21) -- "Bug in Your Hair"
Copyright (C) 2016 The R Foundation for Statistical Computing
Platform: x86_64-pc-linux-gnu (64-bit)

R is free software and comes with ABSOLUTELY NO WARRANTY.
You are welcome to redistribute it under certain conditions.
Type 'license()' or 'licence()' for distribution details.

R is a collaborative project with many contributors.
Type 'contributors()' for more information and
'citation()' on how to cite R or R packages in publications.

Type 'demo()' for some demos, 'help()' for on-line help, or
'help.start()' for an HTML browser interface to help.
Type 'q()' to quit R.

> library(nucleR)
Loading required package: ShortRead
Loading required package: BiocGenerics
Loading required package: parallel

Attaching package: 'BiocGenerics'

The following objects are masked from 'package:parallel':

    clusterApply, clusterApplyLB, clusterCall, clusterEvalQ,
    clusterExport, clusterMap, parApply, parCapply, parLapply,
    parLapplyLB, parRapply, parSapply, parSapplyLB

The following objects are masked from 'package:stats':

    IQR, mad, xtabs

The following objects are masked from 'package:base':

    Filter, Find, Map, Position, Reduce, anyDuplicated, append,
    as.data.frame, cbind, colnames, do.call, duplicated, eval, evalq,
    get, grep, grepl, intersect, is.unsorted, lapply, lengths, mapply,
    match, mget, order, paste, pmax, pmax.int, pmin, pmin.int, rank,
    rbind, rownames, sapply, setdiff, sort, table, tapply, union,
    unique, unsplit

Loading required package: BiocParallel
Loading required package: Biostrings
Loading required package: S4Vectors
Loading required package: stats4

Attaching package: 'S4Vectors'

The following objects are masked from 'package:base':

    colMeans, colSums, expand.grid, rowMeans, rowSums

Loading required package: IRanges
Loading required package: XVector
Loading required package: Rsamtools
Loading required package: GenomeInfoDb
Loading required package: GenomicRanges
Loading required package: GenomicAlignments
Loading required package: SummarizedExperiment
Loading required package: Biobase
Welcome to Bioconductor

    Vignettes contain introductory material; view with
    'browseVignettes()'. To cite Bioconductor, see
    'citation("Biobase")', and for packages 'citation("pkgname")'.

> png(filename="/home/ddbj/snapshot/RGM3/R_BC/result/nucleR/syntheticNucMap.Rd_%03d_medium.png", width=480, height=480)
> ### Name: syntheticNucMap
> ### Title: Generates a synthetic nucleosome map
> ### Aliases: syntheticNucMap
> ### Keywords: datagen
>
> ### ** Examples
>
>
> 	#Generate a synthetic map with 50wp + 20fuzzy nucleosomes using fixed random seed=1
> 	res = syntheticNucMap(wp.num=50, fuz.num=20, show.plot=TRUE, rnd.seed=1)
>
> 	#Increase the fuzzyness
> 	res = syntheticNucMap(wp.num=50, fuz.num=20, wp.var=70, fuz.var=150, show.plot=TRUE, rnd.seed=1)
>
> 	#Calculate also a random map and get the ratio between random and nucleosomal
> 	res = syntheticNucMap(wp.num=50, wp.del=0, fuz.num=20, as.ratio=TRUE, show.plot=TRUE, rnd.seed=1)
>
> 	print(res)
$wp.starts
 [1]    1  168  335  502  669  836 1003 1170 1337 1504 1671 1838 2005 2172 2339
[16] 2506 2673 2840 3007 3174 3341 3508 3675 3842 4009 4176 4343 4510 4677 4844
[31] 5011 5178 5345 5512 5679 5846 6013 6180 6347 6514 6681 6848 7015 7182 7349
[46] 7516 7683 7850 8017 8184

$wp.nreads
 [1]  6  8 12 18  5 18 19 14 13  2  5  4 14  8 16 10 15 20  8 16 19  5 13  3  6
[26]  8  1  8 18  7 10 12 10  5 17 14 16  3 15  9 17 13 16 12 11 16  1 10 15 14

$wp.reads
IRanges object with 555 ranges and 0 metadata columns:
            start       end     width
        <integer> <integer> <integer>
    [1]         0       146       147
    [2]        15       161       147
    [3]        -1       145       147
    [4]        -9       137       147
    [5]       -16       130       147
    ...       ...       ...       ...
  [551]      8197      8343       147
  [552]      8201      8347       147
  [553]      8170      8316       147
  [554]      8194      8340       147
  [555]      8203      8349       147

$fuz.starts
 [1] 8140 2928 3290 7940  891 7805 2891 4452 4499 5968 3389 1277 2842 5233  480
[16] 7112 1776 4505 1141 2713

$fuz.nreads
 [1] 13  6 13 10 19 17  8  7 17 10  7  3  2 14 14 18  7 19  5 16

$fuz.reads
IRanges object with 225 ranges and 0 metadata columns:
            start       end     width
        <integer> <integer> <integer>
    [1]      8112      8258       147
    [2]      8093      8239       147
    [3]      8176      8322       147
    [4]      8159      8305       147
    [5]      8184      8330       147
    ...       ...       ...       ...
  [221]      2703      2849       147
  [222]      2712      2858       147
  [223]      2726      2872       147
  [224]      2735      2881       147
  [225]      2671      2817       147

$syn.reads
IRanges object with 780 ranges and 0 metadata columns:
            start       end     width
        <integer> <integer> <integer>
    [1]         0       146       147
    [2]        15       161       147
    [3]        -1       145       147
    [4]        -9       137       147
    [5]       -16       130       147
    ...       ...       ...       ...
  [776]      2703      2849       147
  [777]      2712      2858       147
  [778]      2726      2872       147
  [779]      2735      2881       147
  [780]      2671      2817       147

$ctr.reads
IRanges object with 780 ranges and 0 metadata columns:
            start       end     width
        <integer> <integer> <integer>
    [1]      3458      3620       163
    [2]      7988      8048        61
    [3]      6676      6745        70
    [4]      1836      1951       116
    [5]      4018      4265       248
    ...       ...       ...       ...
  [776]      2831      2993       163
  [777]      4367      4489       123
  [778]      2134      2294       161
  [779]      4700      4928       229
  [780]      7431      7534       104

$syn.ratio
numeric-Rle of length 8424 with 2329 runs
  Lengths:                 11                  2 ...                 61
  Values :                 NA   2.32192809488736 ...   2.58496250072116

>
> 	#Different reads can be accessed separately from results
> 	#Let's use this to plot the nucleosomal + the random map
> 	par(mfrow=c(3,1), mar=c(3,4,1,1))
> 	plot(as.vector(coverage(res$syn.reads)), type="h", col="red", ylab="nucleosomal", ylim=c(0,35))
> 	plot(as.vector(coverage(res$ctr.reads)), type="h", col="blue", ylab="random", ylim=c(0,35))
> 	plot(as.vector(res$syn.ratio), type="h", col="orange", ylab="ratio")
>
>
>
>
>
> dev.off()
null device
          1
>
 .
.