Supported by Dr. Osamu Ogasawara and  . . |
|
Last data update: 2014.03.03 |
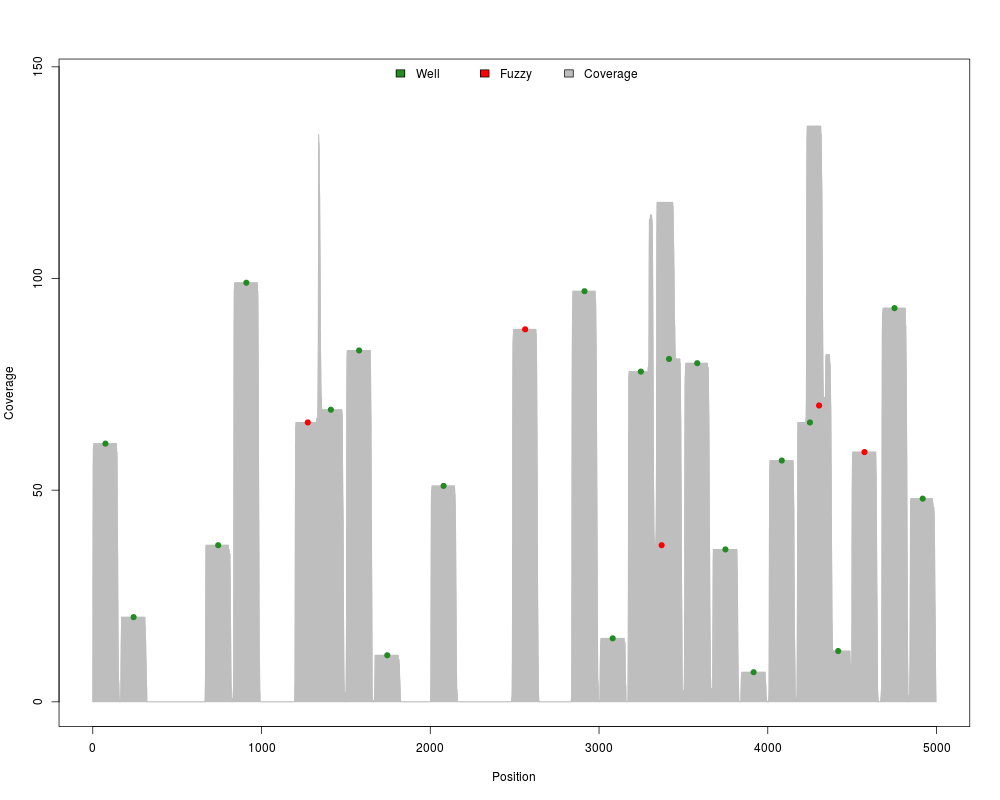
Generate a graph of a synthetic nucleosome mapDescriptionGenerate a graph for
a list marked as an Usage## S3 method for class 'syntheticNucMap' plot(x, ...) Arguments
Valuea graph of a synthetic nucleosome map Author(s)Astrid Deschenes, Rawane Samb Examples## Generate a synthetic map with 20 well-positioned nucleosomes, 5 fuzzy ## nucleosomes and 10 deleted nucleosomes using a Student distribution ## with a variance of 10 for the well-positioned nucleosomes, ## a variance of 20 for the fuzzy nucleosomes and a seed of 15 syntheticMap <- syntheticNucMapFromDist(wp.num = 30, wp.del = 10, wp.var = 10, fuz.num = 5, fuz.var = 20, rnd.seed = 15, distr = "Student") ## Create graph using the synthetic map plot(syntheticMap, xlab="Position", ylab="Coverage") Results
R version 3.3.1 (2016-06-21) -- "Bug in Your Hair"
Copyright (C) 2016 The R Foundation for Statistical Computing
Platform: x86_64-pc-linux-gnu (64-bit)

R is free software and comes with ABSOLUTELY NO WARRANTY.
You are welcome to redistribute it under certain conditions.
Type 'license()' or 'licence()' for distribution details.

R is a collaborative project with many contributors.
Type 'contributors()' for more information and
'citation()' on how to cite R or R packages in publications.

Type 'demo()' for some demos, 'help()' for on-line help, or
'help.start()' for an HTML browser interface to help.
Type 'q()' to quit R.

> library(nucleoSim)
> png(filename="/home/ddbj/snapshot/RGM3/R_BC/result/nucleoSim/plot.syntheticNucMap.Rd_%03d_medium.png", width=480, height=480)
> ### Name: plot.syntheticNucMap
> ### Title: Generate a graph of a synthetic nucleosome map
> ### Aliases: plot.syntheticNucMap
>
> ### ** Examples
>
>
> ## Generate a synthetic map with 20 well-positioned nucleosomes, 5 fuzzy
> ## nucleosomes and 10 deleted nucleosomes using a Student distribution
> ## with a variance of 10 for the well-positioned nucleosomes,
> ## a variance of 20 for the fuzzy nucleosomes and a seed of 15
> syntheticMap <- syntheticNucMapFromDist(wp.num = 30, wp.del = 10,
+ wp.var = 10, fuz.num = 5, fuz.var = 20, rnd.seed = 15,
+ distr = "Student")
>
> ## Create graph using the synthetic map
> plot(syntheticMap, xlab="Position", ylab="Coverage")
>
>
>
>
>
>
> dev.off()
null device
          1
>
|
Created & Maintained by Osamu Ogasawara (osamu.ogasawara@gmail.com) and 