Supported by Dr. Osamu Ogasawara and  . . |
|
Last data update: 2014.03.03 |
Produce heatmap from phenotype data.DescriptionShow the associations between clusters that each sample belongs to and each phenotype in a heatmap and/or a Kaplan-Meier plot. UsageheatmapPhenoTest(x, signatures, vars2test, probes2genes = FALSE, filterVar, filteralpha = 0.05, distCol = "pearson", nClust = 2, distRow = "cor", p.adjust.method = "none", simulate.p.value = FALSE, B = 10^5, linkage = "average", equalize = FALSE, center = TRUE, col, survCol, heat.kaplan="both", ...) Arguments
DetailsMakes two clusters of samples based on the expression levels of the genes from the given signature and plots a heatmap and/or a Kaplan-Meier showing the association between belonging to one cluster or the other and each phenotype. For variables in vars2test$continuous and vars2test$ordinal a Kruskal-Wallis Rank Sum test is
used; for vars2test$categorical a chi-square test (with exact p-value
if Author(s)David Rossell Examples
#load data
data(eset)
eset
#construct vars2test
survival <- matrix(c("Relapse","Months2Relapse"),ncol=2,byrow=TRUE)
colnames(survival) <- c('event','time')
vars2test <- list(survival=survival)
vars2test
#construct a signature
sign <- sample(featureNames(eset))[1:20]
#make plot
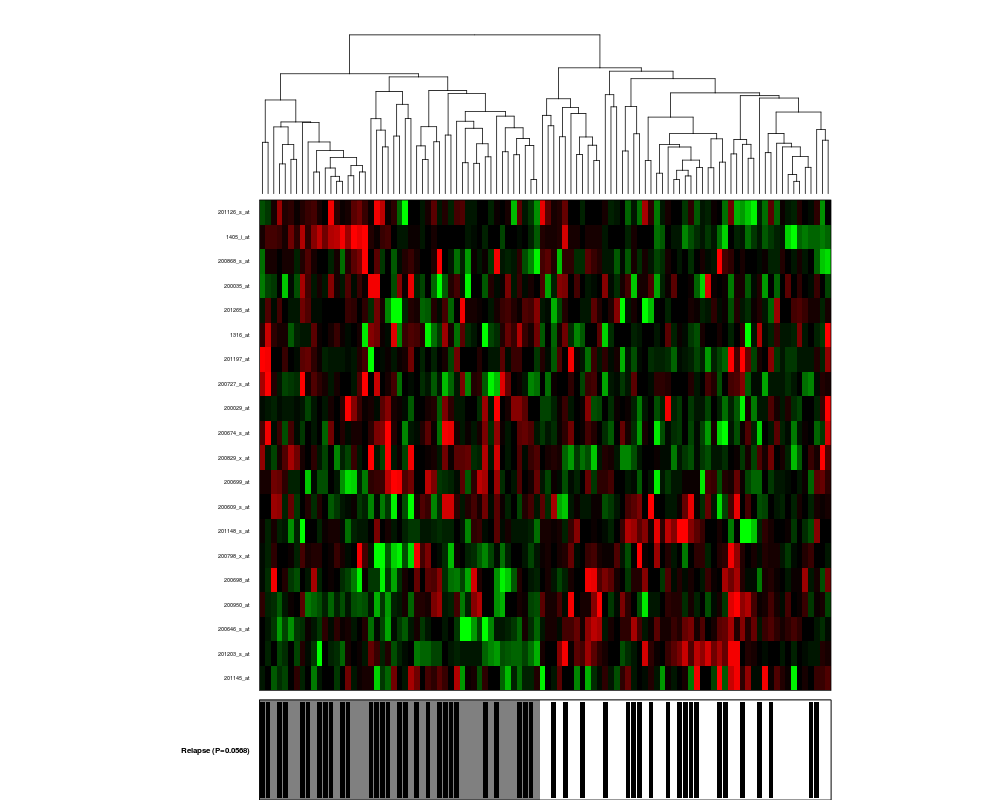
heatmapPhenoTest(eset,sign,vars2test=vars2test,heat.kaplan='heat')
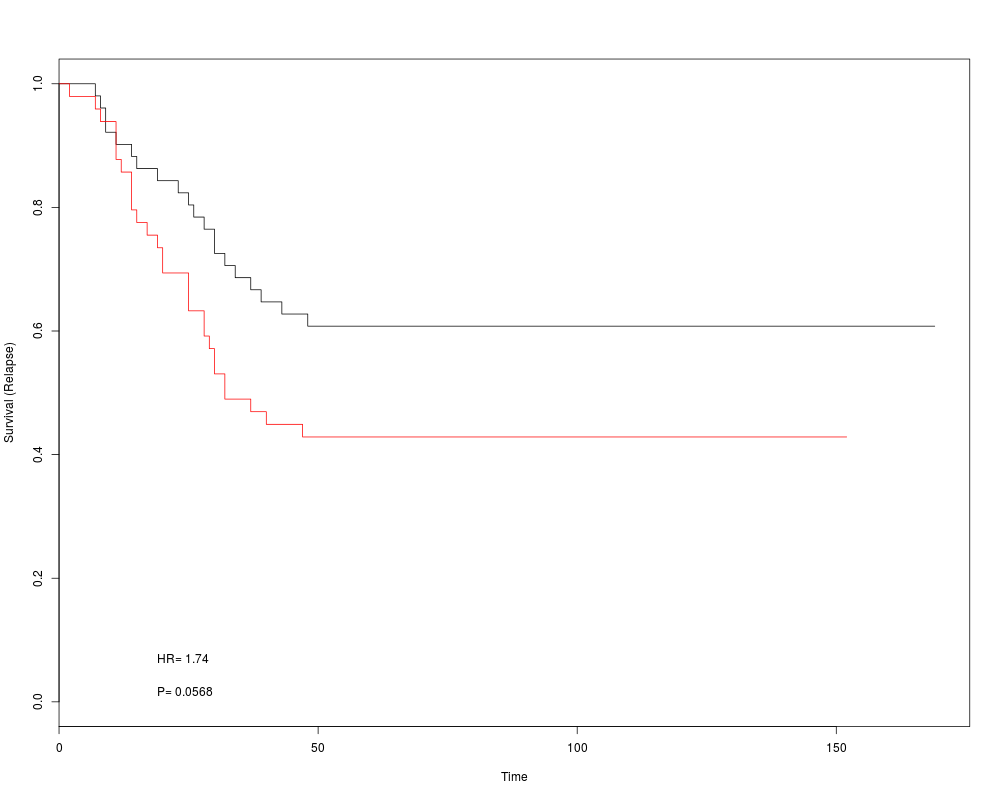
heatmapPhenoTest(eset,sign,vars2test=vars2test,heat.kaplan='kaplan')
Results
R version 3.3.1 (2016-06-21) -- "Bug in Your Hair"
Copyright (C) 2016 The R Foundation for Statistical Computing
Platform: x86_64-pc-linux-gnu (64-bit)

R is free software and comes with ABSOLUTELY NO WARRANTY.
You are welcome to redistribute it under certain conditions.
Type 'license()' or 'licence()' for distribution details.

R is a collaborative project with many contributors.
Type 'contributors()' for more information and
'citation()' on how to cite R or R packages in publications.

Type 'demo()' for some demos, 'help()' for on-line help, or
'help.start()' for an HTML browser interface to help.
Type 'q()' to quit R.

> library(phenoTest)
Loading required package: Biobase
Loading required package: BiocGenerics
Loading required package: parallel

Attaching package: 'BiocGenerics'

The following objects are masked from 'package:parallel':

    clusterApply, clusterApplyLB, clusterCall, clusterEvalQ,
    clusterExport, clusterMap, parApply, parCapply, parLapply,
    parLapplyLB, parRapply, parSapply, parSapplyLB

The following objects are masked from 'package:stats':

    IQR, mad, xtabs

The following objects are masked from 'package:base':

    Filter, Find, Map, Position, Reduce, anyDuplicated, append,
    as.data.frame, cbind, colnames, do.call, duplicated, eval, evalq,
    get, grep, grepl, intersect, is.unsorted, lapply, lengths, mapply,
    match, mget, order, paste, pmax, pmax.int, pmin, pmin.int, rank,
    rbind, rownames, sapply, setdiff, sort, table, tapply, union,
    unique, unsplit

Welcome to Bioconductor

    Vignettes contain introductory material; view with
    'browseVignettes()'. To cite Bioconductor, see
    'citation("Biobase")', and for packages 'citation("pkgname")'.

Loading required package: annotate
Loading required package: AnnotationDbi
Loading required package: stats4
Loading required package: IRanges
Loading required package: S4Vectors

Attaching package: 'S4Vectors'

The following objects are masked from 'package:base':

    colMeans, colSums, expand.grid, rowMeans, rowSums

Loading required package: XML
Loading required package: Heatplus
Loading required package: BMA
Loading required package: survival
Loading required package: leaps
Loading required package: robustbase

Attaching package: 'robustbase'

The following object is masked from 'package:survival':

    heart

The following object is masked from 'package:Biobase':

    rowMedians

Loading required package: inline
Loading required package: rrcov
Scalable Robust Estimators with High Breakdown Point (version 1.3-11)

Loading required package: ggplot2

/////////////////////////////////////////////////////////////////////////////

//------------------    Thanks for using HTSanalyzeR    -------------------//

//------------please use function changes() to see new changes-------------//

//------------please report any bug to xinwang2hms@gmail.com---------------//

/////////////////////////////////////////////////////////////////////////////
Warning message:
replacing previous import 'igraph::union' by 'GSEABase::union' when loading 'HTSanalyzeR'
> png(filename="/home/ddbj/snapshot/RGM3/R_BC/result/phenoTest/heatmapPhenoTest.Rd_%03d_medium.png", width=480, height=480)
> ### Name: heatmapPhenoTest
> ### Title: Produce heatmap from phenotype data.
> ### Aliases: heatmapPhenoTest
>
> ### ** Examples
>
> #load data
> data(eset)
> eset
ExpressionSet (storageMode: lockedEnvironment)
assayData: 1000 features, 100 samples
  element names: exprs
protocolData: none
phenoData
  sampleNames: GSM36793 GSM36796 ... GSM36924 (100 total)
  varLabels: PID GEOaccession ... BrainRelapse (7 total)
  varMetadata: labelDescription
featureData: none
experimentData: use 'experimentData(object)'
Annotation: hgu133a
>
> #construct vars2test
> survival <- matrix(c("Relapse","Months2Relapse"),ncol=2,byrow=TRUE)
> colnames(survival) <- c('event','time')
> vars2test <- list(survival=survival)
> vars2test
$survival
     event     time
[1,] "Relapse" "Months2Relapse"

>
> #construct a signature
> sign <- sample(featureNames(eset))[1:20]
>
> #make plot
> heatmapPhenoTest(eset,sign,vars2test=vars2test,heat.kaplan='heat')
Months2Relapse
  "(P=0.3894)"
> heatmapPhenoTest(eset,sign,vars2test=vars2test,heat.kaplan='kaplan')
Months2Relapse
  "(P=0.3894)"
>
>
>
>
>
> dev.off()
null device
          1
>
|