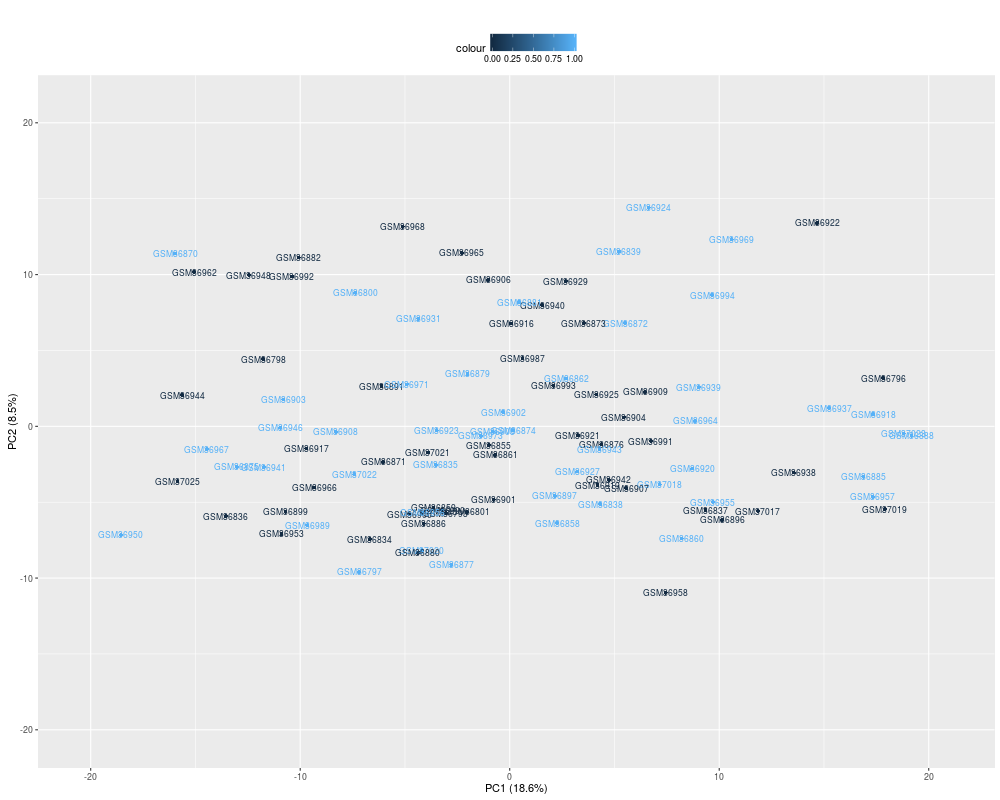
Creates a Principal Components plot where we can show paired samples,
and confidence intervals for the mean of every group of interest.
We can also choose the component or components we want to plot.
Variable in pData(x) that contains the groups of interest. Samples
of the same group will be plotted with the same color.
group2
Variable in pData(x) that contains secondary groups of
interest. Sample of the same secondary group of interest will be
plotted with the same symbol.
pair
Variable in pData(x) that contains the information about the pairs
of data. Those pairs will be joined by a line.
names
Variable in pData(x) that contains the information about the names
of the samples.
ellipse
If we want to plot ellipses with the 95 percent confidence intervals
for every group.
main
A title for the plot.
components
Which components we want to plot. By default the first principal
component will be plotted on the x axis and the second principal
component will be plotted on the y axis.
More than two components may be specified. If so multiple plots will
be produced.
R version 3.3.1 (2016-06-21) -- "Bug in Your Hair"
Copyright (C) 2016 The R Foundation for Statistical Computing
Platform: x86_64-pc-linux-gnu (64-bit)

R is free software and comes with ABSOLUTELY NO WARRANTY.
You are welcome to redistribute it under certain conditions.
Type 'license()' or 'licence()' for distribution details.

R is a collaborative project with many contributors.
Type 'contributors()' for more information and
'citation()' on how to cite R or R packages in publications.

Type 'demo()' for some demos, 'help()' for on-line help, or
'help.start()' for an HTML browser interface to help.
Type 'q()' to quit R.

> library(phenoTest)
Loading required package: Biobase
Loading required package: BiocGenerics
Loading required package: parallel

Attaching package: 'BiocGenerics'

The following objects are masked from 'package:parallel':

    clusterApply, clusterApplyLB, clusterCall, clusterEvalQ,
    clusterExport, clusterMap, parApply, parCapply, parLapply,
    parLapplyLB, parRapply, parSapply, parSapplyLB

The following objects are masked from 'package:stats':

    IQR, mad, xtabs

The following objects are masked from 'package:base':

    Filter, Find, Map, Position, Reduce, anyDuplicated, append,
    as.data.frame, cbind, colnames, do.call, duplicated, eval, evalq,
    get, grep, grepl, intersect, is.unsorted, lapply, lengths, mapply,
    match, mget, order, paste, pmax, pmax.int, pmin, pmin.int, rank,
    rbind, rownames, sapply, setdiff, sort, table, tapply, union,
    unique, unsplit

Welcome to Bioconductor

    Vignettes contain introductory material; view with
    'browseVignettes()'. To cite Bioconductor, see
    'citation("Biobase")', and for packages 'citation("pkgname")'.

Loading required package: annotate
Loading required package: AnnotationDbi
Loading required package: stats4
Loading required package: IRanges
Loading required package: S4Vectors

Attaching package: 'S4Vectors'

The following objects are masked from 'package:base':

    colMeans, colSums, expand.grid, rowMeans, rowSums

Loading required package: XML
Loading required package: Heatplus
Loading required package: BMA
Loading required package: survival
Loading required package: leaps
Loading required package: robustbase

Attaching package: 'robustbase'

The following object is masked from 'package:survival':

    heart

The following object is masked from 'package:Biobase':

    rowMedians

Loading required package: inline
Loading required package: rrcov
Scalable Robust Estimators with High Breakdown Point (version 1.3-11)

Loading required package: ggplot2

/////////////////////////////////////////////////////////////////////////////

//------------------    Thanks for using HTSanalyzeR    -------------------//

//------------please use function changes() to see new changes-------------//

//------------please report any bug to xinwang2hms@gmail.com---------------//

/////////////////////////////////////////////////////////////////////////////
Warning message:
replacing previous import 'igraph::union' by 'GSEABase::union' when loading 'HTSanalyzeR'
> png(filename="/home/ddbj/snapshot/RGM3/R_BC/result/phenoTest/pca.Rd_%03d_medium.png", width=480, height=480)
> ### Name: pca
> ### Title: Principal components plot.
> ### Aliases: pca
> ### Keywords: datasets
>
> ### ** Examples
>
> data(eset)
> pca(x=eset, group='Relapse', names='GEOaccession')
> #pca(x=eset, group='Relapse', names='GEOaccession', components=1:3)
>
>
>
>
>
> dev.off()
null device
          1
>
 .
.