Supported by Dr. Osamu Ogasawara and  . . |
|
Last data update: 2014.03.03 |
Summary plots for gene signature vs phenotype associationDescriptionSummarizes the univariate relationships between genes in one or more
signatures and several phenotype variables, as summarized in
By default UsagebarplotSignatures(x, signatures, referenceSignature, alpha=.05, p.adjust.method='none', ylab, cex.text=1, ...) barplotSignifSignatures(x, signatures, referenceSignature, testUpDown=FALSE, simulate.p.value = FALSE, B = 10^4, p.adjust.method='none', alpha=.05, ylab, ylim=ylim, cex.text=1, ...) Arguments
ValueWhen a single signature is provided as input, a single plot assessing the association of that signature with all phenotype variables is created. If several signatures are provided, one separate plot is created for each phenotype variable. Author(s)Evarist Planet Examples
#create epheno
data(epheno)
#construct two signatures
sign1 <- sample(featureNames(epheno))[1:20]
sign2 <- sample(featureNames(epheno))[1:15]
mySignature <- list(sign1,sign2)
names(mySignature) <- c('My first signature','My preferred signature')
#plot
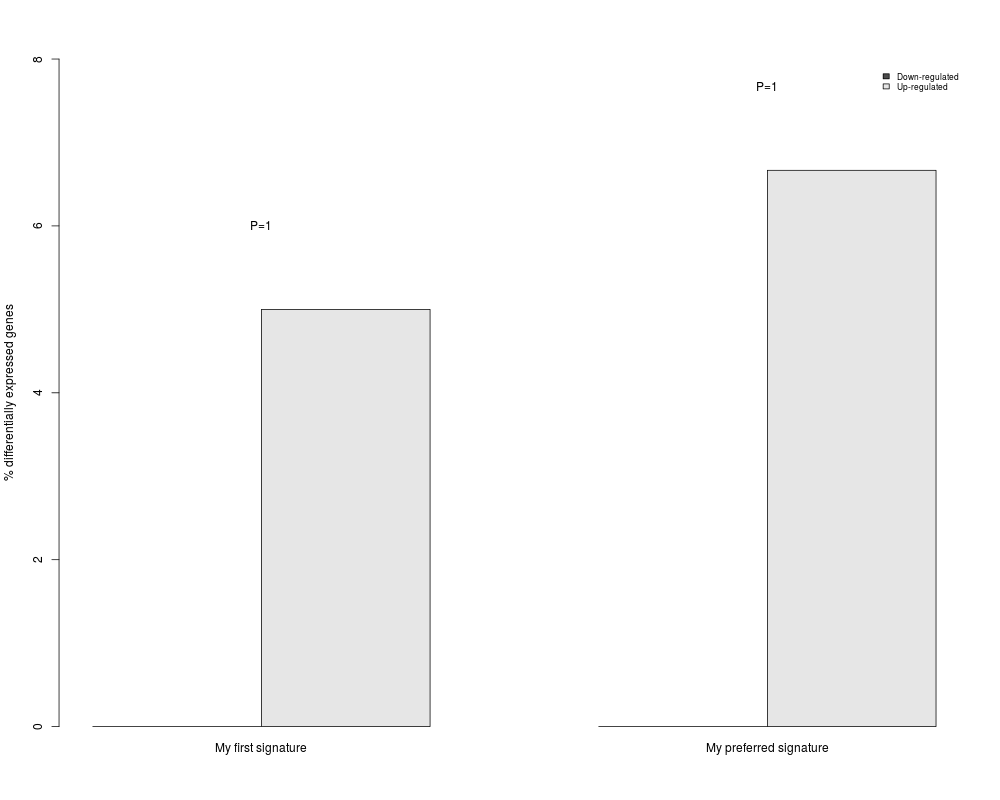
barplotSignifSignatures(epheno[,'Relapse'],mySignature,alpha=0.05)
Results
R version 3.3.1 (2016-06-21) -- "Bug in Your Hair"
Copyright (C) 2016 The R Foundation for Statistical Computing
Platform: x86_64-pc-linux-gnu (64-bit)

R is free software and comes with ABSOLUTELY NO WARRANTY.
You are welcome to redistribute it under certain conditions.
Type 'license()' or 'licence()' for distribution details.

R is a collaborative project with many contributors.
Type 'contributors()' for more information and
'citation()' on how to cite R or R packages in publications.

Type 'demo()' for some demos, 'help()' for on-line help, or
'help.start()' for an HTML browser interface to help.
Type 'q()' to quit R.

> library(phenoTest)
Loading required package: Biobase
Loading required package: BiocGenerics
Loading required package: parallel

Attaching package: 'BiocGenerics'

The following objects are masked from 'package:parallel':

    clusterApply, clusterApplyLB, clusterCall, clusterEvalQ,
    clusterExport, clusterMap, parApply, parCapply, parLapply,
    parLapplyLB, parRapply, parSapply, parSapplyLB

The following objects are masked from 'package:stats':

    IQR, mad, xtabs

The following objects are masked from 'package:base':

    Filter, Find, Map, Position, Reduce, anyDuplicated, append,
    as.data.frame, cbind, colnames, do.call, duplicated, eval, evalq,
    get, grep, grepl, intersect, is.unsorted, lapply, lengths, mapply,
    match, mget, order, paste, pmax, pmax.int, pmin, pmin.int, rank,
    rbind, rownames, sapply, setdiff, sort, table, tapply, union,
    unique, unsplit

Welcome to Bioconductor

    Vignettes contain introductory material; view with
    'browseVignettes()'. To cite Bioconductor, see
    'citation("Biobase")', and for packages 'citation("pkgname")'.

Loading required package: annotate
Loading required package: AnnotationDbi
Loading required package: stats4
Loading required package: IRanges
Loading required package: S4Vectors

Attaching package: 'S4Vectors'

The following objects are masked from 'package:base':

    colMeans, colSums, expand.grid, rowMeans, rowSums

Loading required package: XML
Loading required package: Heatplus
Loading required package: BMA
Loading required package: survival
Loading required package: leaps
Loading required package: robustbase

Attaching package: 'robustbase'

The following object is masked from 'package:survival':

    heart

The following object is masked from 'package:Biobase':

    rowMedians

Loading required package: inline
Loading required package: rrcov
Scalable Robust Estimators with High Breakdown Point (version 1.3-11)

Loading required package: ggplot2

/////////////////////////////////////////////////////////////////////////////

//------------------    Thanks for using HTSanalyzeR    -------------------//

//------------please use function changes() to see new changes-------------//

//------------please report any bug to xinwang2hms@gmail.com---------------//

/////////////////////////////////////////////////////////////////////////////
Warning message:
replacing previous import 'igraph::union' by 'GSEABase::union' when loading 'HTSanalyzeR'
> png(filename="/home/ddbj/snapshot/RGM3/R_BC/result/phenoTest/plots4epheno.Rd_%03d_medium.png", width=480, height=480)
> ### Name: barplotSignatures
> ### Title: Summary plots for gene signature vs phenotype association
> ### Aliases: barplotSignatures barplotSignifSignatures
> ### Keywords: graph
>
> ### ** Examples
>
> #create epheno
> data(epheno)
>
> #construct two signatures
> sign1 <- sample(featureNames(epheno))[1:20]
> sign2 <- sample(featureNames(epheno))[1:15]
> mySignature <- list(sign1,sign2)
> names(mySignature) <- c('My first signature','My preferred signature')
>
> #plot
> barplotSignifSignatures(epheno[,'Relapse'],mySignature,alpha=0.05)
>
>
>
>
>
> dev.off()
null device
          1
>
|