numeric containing the expression levels of a given gene.
xlim
xlim for the plot.
ylim
ylim for the plot.
xlab
xlab for the plot.
ylab
ylab for the plot.
logrisk
logrisk if we want to compute risk or logrisk
estimates. By default this is TRUE, which has a better behaviour
under small sample sizes.
...
other arguments that will be passed to plot.
Author(s)
David Rossell.
Examples
#load eset
data(eset)

#make plot
smoothCoxph(pData(eset)$Months2Relapse,pData(eset)$Relapse,exprs(eset)[25,])
Results
R version 3.3.1 (2016-06-21) -- "Bug in Your Hair"
Copyright (C) 2016 The R Foundation for Statistical Computing
Platform: x86_64-pc-linux-gnu (64-bit)
R is free software and comes with ABSOLUTELY NO WARRANTY.
You are welcome to redistribute it under certain conditions.
Type 'license()' or 'licence()' for distribution details.
R is a collaborative project with many contributors.
Type 'contributors()' for more information and
'citation()' on how to cite R or R packages in publications.
Type 'demo()' for some demos, 'help()' for on-line help, or
'help.start()' for an HTML browser interface to help.
Type 'q()' to quit R.
> library(phenoTest)
Loading required package: Biobase
Loading required package: BiocGenerics
Loading required package: parallel
Attaching package: 'BiocGenerics'
The following objects are masked from 'package:parallel':
clusterApply, clusterApplyLB, clusterCall, clusterEvalQ,
clusterExport, clusterMap, parApply, parCapply, parLapply,
parLapplyLB, parRapply, parSapply, parSapplyLB
The following objects are masked from 'package:stats':
IQR, mad, xtabs
The following objects are masked from 'package:base':
Filter, Find, Map, Position, Reduce, anyDuplicated, append,
as.data.frame, cbind, colnames, do.call, duplicated, eval, evalq,
get, grep, grepl, intersect, is.unsorted, lapply, lengths, mapply,
match, mget, order, paste, pmax, pmax.int, pmin, pmin.int, rank,
rbind, rownames, sapply, setdiff, sort, table, tapply, union,
unique, unsplit
Welcome to Bioconductor
Vignettes contain introductory material; view with
'browseVignettes()'. To cite Bioconductor, see
'citation("Biobase")', and for packages 'citation("pkgname")'.
Loading required package: annotate
Loading required package: AnnotationDbi
Loading required package: stats4
Loading required package: IRanges
Loading required package: S4Vectors
Attaching package: 'S4Vectors'
The following objects are masked from 'package:base':
colMeans, colSums, expand.grid, rowMeans, rowSums
Loading required package: XML
Loading required package: Heatplus
Loading required package: BMA
Loading required package: survival
Loading required package: leaps
Loading required package: robustbase
Attaching package: 'robustbase'
The following object is masked from 'package:survival':
heart
The following object is masked from 'package:Biobase':
rowMedians
Loading required package: inline
Loading required package: rrcov
Scalable Robust Estimators with High Breakdown Point (version 1.3-11)
Loading required package: ggplot2
/////////////////////////////////////////////////////////////////////////////
//------------------ Thanks for using HTSanalyzeR -------------------//
//------------please use function changes() to see new changes-------------//
//------------please report any bug to xinwang2hms@gmail.com---------------//
/////////////////////////////////////////////////////////////////////////////
Warning message:
replacing previous import 'igraph::union' by 'GSEABase::union' when loading 'HTSanalyzeR'
> png(filename="/home/ddbj/snapshot/RGM3/R_BC/result/phenoTest/smoothCoxph.Rd_%03d_medium.png", width=480, height=480)
> ### Name: smoothCoxph
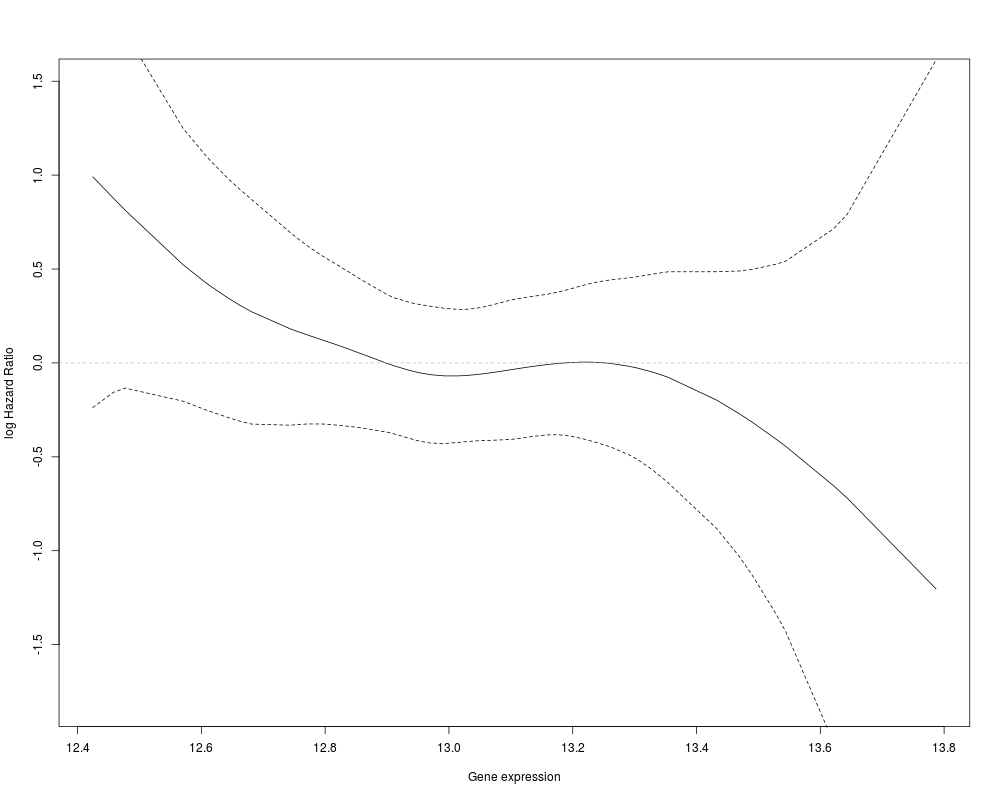
> ### Title: Plots the Cox proportional hazard smoothed by gene expression
> ### level.
> ### Aliases: smoothCoxph
> ### Keywords: datasets
>
> ### ** Examples
>
> #load eset
> data(eset)
>
> #make plot
> smoothCoxph(pData(eset)$Months2Relapse,pData(eset)$Relapse,exprs(eset)[25,])
>
>
>
>
>
> dev.off()
null device
1
>
 .
.