A specialized function for creating a network representation of microbiomes,
sample-wise or taxa-wise,
based on a user-defined ecological distance and (potentially arbitrary) threshold.
The graph is ultimately represented using the
igraph-package.
(Required). Default NULL.
A phyloseq-class object,
or otu_table-class object,
on which g is based. phyloseq-class recommended.
type
(Optional). Default "samples".
Whether the network should be samples or taxa/OTUs.
Supported arguments are "samples", "taxa",
where "taxa" indicates using the OTUs/taxaindices,
whether they actually represent species or some other taxonomic rank.
NOTE: not all distance methods are supported if "taxa"
selected for type. For example, the UniFrac distance and DPCoA
cannot be calculated for taxa-wise distances, because they use
a taxa-wise tree as part of their calculation between samples, and
there is no transpose-equivalent for this tree.
distance
(Optional). Default "jaccard".
Any supported argument to the method parameter of the
distance function is supported here.
Some distance methods, like "unifrac", may take
a non-trivial amount of time to calculate, in which case
you probably want to calculate the distance matrix separately,
save, and then provide it as the argument to distance instead.
See below for alternatives).
Alternatively, if you have already calculated the sample-wise distance
object, the resulting dist-class object
can be provided as distance instead (see examples).
A third alternative is to provide a function that takes
a sample-by-taxa matrix (typical vegan orientation)
and returns a sample-wise distance
matrix.
max.dist
(Optional). Default 0.4.
The maximum ecological distance (as defined by distance)
allowed between two samples to still consider them “connected”
by an edge in the graphical model.
keep.isolates
(Optional). Default FALSE. Logical.
Whether to keep isolates (un-connected samples, not microbial isolates)
in the graphical model that is returned. Default results in isolates
being removed from the object.
...
(Optional). Additional parameters passed on to distance.
Value
A igraph-class object.
See Also
plot_network
Examples
# # Example plots with Enterotype Dataset
data(enterotype)
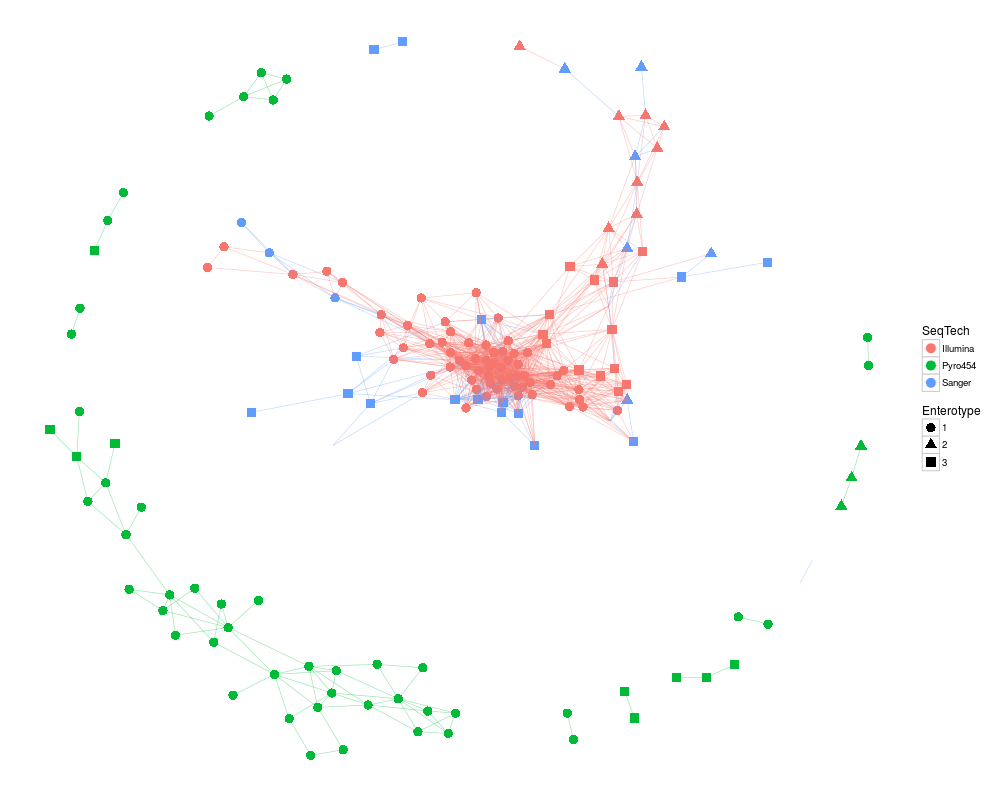
ig <- make_network(enterotype, max.dist=0.3)
plot_network(ig, enterotype, color="SeqTech", shape="Enterotype", line_weight=0.3, label=NULL)
#
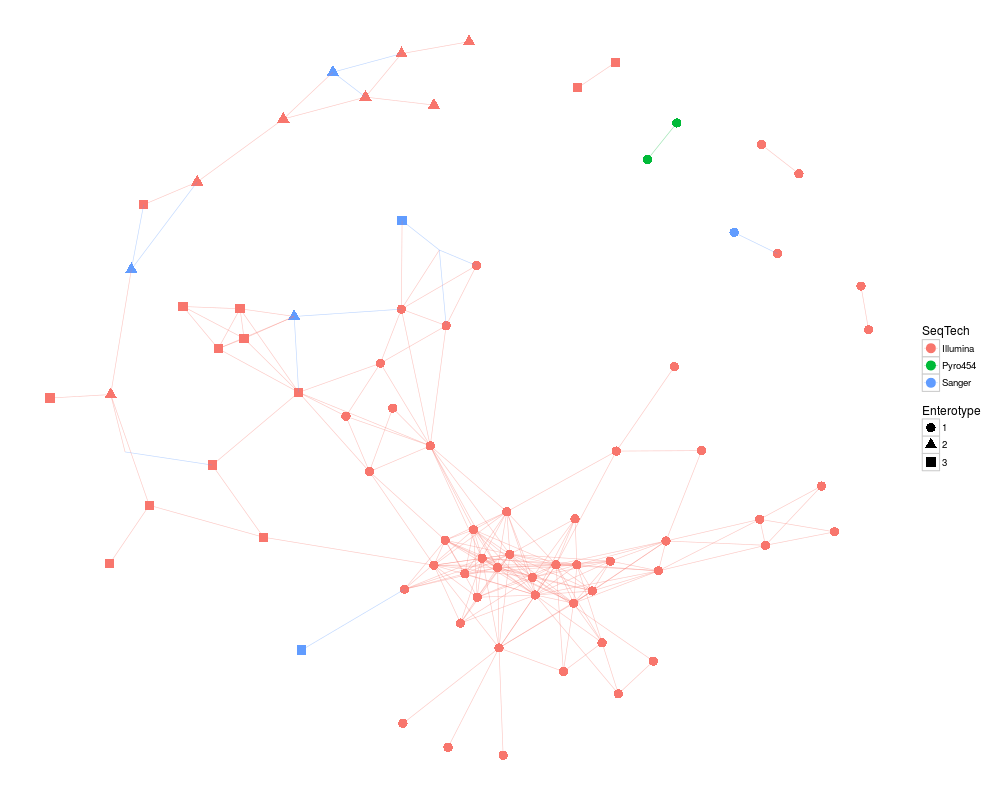
ig1 <- make_network(enterotype, max.dist=0.2)
plot_network(ig1, enterotype, color="SeqTech", shape="Enterotype", line_weight=0.3, label=NULL)
#
# # Three methods of choosing/providing distance/distance-method
# Provide method name available to distance() function
ig <- make_network(enterotype, max.dist=0.3, distance="jaccard")
# Provide distance object, already computed
jaccdist <- distance(enterotype, "jaccard")
ih <- make_network(enterotype, max.dist=0.3, distance=jaccdist)
# Provide "custom" function.
ii <- make_network(enterotype, max.dist=0.3, distance=function(x){vegan::vegdist(x, "jaccard")})
# The have equal results:
all.equal(ig, ih)
all.equal(ig, ii)
#
# Try out making a trivial "network" of the 3-sample esophagus data,
# with weighted-UniFrac as distance
data(esophagus)
ij <- make_network(esophagus, "samples", "unifrac", weighted=TRUE)
Results
R version 3.3.1 (2016-06-21) -- "Bug in Your Hair"
Copyright (C) 2016 The R Foundation for Statistical Computing
Platform: x86_64-pc-linux-gnu (64-bit)

R is free software and comes with ABSOLUTELY NO WARRANTY.
You are welcome to redistribute it under certain conditions.
Type 'license()' or 'licence()' for distribution details.

R is a collaborative project with many contributors.
Type 'contributors()' for more information and
'citation()' on how to cite R or R packages in publications.

Type 'demo()' for some demos, 'help()' for on-line help, or
'help.start()' for an HTML browser interface to help.
Type 'q()' to quit R.

> library(phyloseq)
> png(filename="/home/ddbj/snapshot/RGM3/R_BC/result/phyloseq/make_network.Rd_%03d_medium.png", width=480, height=480)
> ### Name: make_network
> ### Title: Make microbiome network (igraph)
> ### Aliases: make_network
>
> ### ** Examples
>
> # # Example plots with Enterotype Dataset
> data(enterotype)
> ig <- make_network(enterotype, max.dist=0.3)
> plot_network(ig, enterotype, color="SeqTech", shape="Enterotype", line_weight=0.3, label=NULL)
Warning message:
attributes are not identical across measure variables; they will be dropped
> #
> ig1 <- make_network(enterotype, max.dist=0.2)
> plot_network(ig1, enterotype, color="SeqTech", shape="Enterotype", line_weight=0.3, label=NULL)
Warning message:
attributes are not identical across measure variables; they will be dropped
> #
> # # Three methods of choosing/providing distance/distance-method
> # Provide method name available to distance() function
> ig <- make_network(enterotype, max.dist=0.3, distance="jaccard")
> # Provide distance object, already computed
> jaccdist <- distance(enterotype, "jaccard")
> ih <- make_network(enterotype, max.dist=0.3, distance=jaccdist)
> # Provide "custom" function.
> ii <- make_network(enterotype, max.dist=0.3, distance=function(x){vegan::vegdist(x, "jaccard")})
> # The have equal results:
> all.equal(ig, ih)
[1] "Component 10: Component 2: 1 string mismatch"
> all.equal(ig, ii)
[1] "Component 10: Component 2: 1 string mismatch"
> #
> # Try out making a trivial "network" of the 3-sample esophagus data,
> # with weighted-UniFrac as distance
> data(esophagus)
> ij <- make_network(esophagus, "samples", "unifrac", weighted=TRUE)
>
>
>
>
>
> dev.off()
null device
          1
>
 .
.