Last data update: 2014.03.03
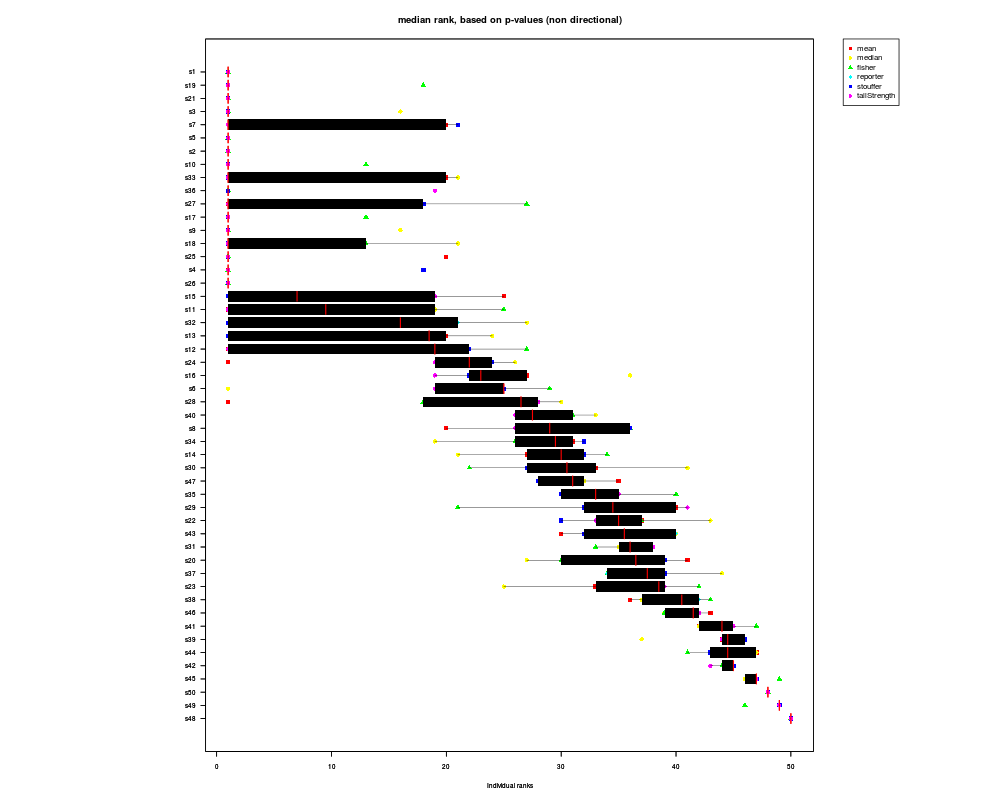
R: Top consensus gene sets and boxplot
consensusScoresR Documentation

Top consensus gene sets and boxplot

Description

Calculates the consensus scores for the gene sets using multiple gene set analysis methods (with runGSA()). Optionally also produces a boxplot to visualize the results.

Usage

   consensusScores(resList, class, direction, n=50, adjusted=FALSE, method="median", 
                   plot=TRUE, cexLabel=0.8, cexLegend=1, showLegend=TRUE, rowNames="names", 
                   logScale=FALSE, main)  

Arguments

resList

a list where each element is an object of class GSAres, as returned by the runGSA function.

class

a character string determining the p-values of which directionality class that should be used as significance information for the plot. Can be one of "distinct", "mixed", "non".

direction

a character string giving the direction of regulation, can be either "up" or "down".

n

consensus rank cutoff. All gene sets with consensus rank (see details below) <=n will be included in the plot. Defaults to 50.

adjusted

a logical, whether to use adjusted p-values or not. Note that if runGSA was run with the argument adjMethod="none", the adjusted p-values will be equal to the original p-values.

method

a character string selecting the method, either "mean", "median", "Borda" or "Copeland".

plot

a logical, whether or not to draw the boxplot.

cexLabel

the x- and y-axis label sizes.

cexLegend

the legend text size.

showLegend

a logical, whether or not to show the legend and the indivual method ranks as points in the plot.

rowNames

a character string determining which rownames to use, set to either "ranks" for the consensus rank, "names" for the gene set names, or "none" to omit rownames.

logScale

a logical, whether or not to use log-scale for the x-axis.

main

a character vector giving an alternative title of the plot.

Details

Based on the results given by the elements of resList, preferably representing similar runs with runGSA but with different methods, this function ranks the gene sets for each GSAres object, based on the selected directionality class. Next, the median rank for each gene set is taken as a score for top-ranking gene sets. The highest scoring gene-sets (with consensus rank, i.e. rank(rankScore,ties.method="min"), smaller or equal to n) are selected and depicted in a boxplot, showing the distribution of individual ranks (shown as colored points), as well as the median rank (shown as a red line). As an alternative of using the median rank as consensus score, it is possible to choose the mean or using the Borda or Copeland method, through the method argument.

All elements of resList have to be objects containing results for the same number of gene-sets. The ranking procedure handles ties by giving them their minimum rank.

Value

A list containing a matrix of the ranks for the top n gene sets, given by each run, as well as the corresponding matrix of p-values, given by each run.

Author(s)

Leif Varemo piano.rpkg@gmail.com and Intawat Nookaew piano.rpkg@gmail.com

See Also

piano, runGSA

Examples

   # Load some example GSA results:
   data(gsa_results)
      
   # Consensus scores for the top 50 gene sets (in the non-directional class):
   cs <- consensusScores(resList=gsa_results,class="non")
   
   # Access the ranks given to gene set s7 by each individual method:
   cs$rankMat["s7",]

Results


R version 3.3.1 (2016-06-21) -- "Bug in Your Hair"
Copyright (C) 2016 The R Foundation for Statistical Computing
Platform: x86_64-pc-linux-gnu (64-bit)

R is free software and comes with ABSOLUTELY NO WARRANTY.
You are welcome to redistribute it under certain conditions.
Type 'license()' or 'licence()' for distribution details.

R is a collaborative project with many contributors.
Type 'contributors()' for more information and
'citation()' on how to cite R or R packages in publications.

Type 'demo()' for some demos, 'help()' for on-line help, or
'help.start()' for an HTML browser interface to help.
Type 'q()' to quit R.

> library(piano)
Warning messages:
1: replacing previous import 'BiocGenerics::union' by 'igraph::union' when loading 'piano' 
2: replacing previous import 'BiocGenerics::normalize' by 'igraph::normalize' when loading 'piano' 
> png(filename="/home/ddbj/snapshot/RGM3/R_BC/result/piano/consensusScores.Rd_%03d_medium.png", width=480, height=480)
> ### Name: consensusScores
> ### Title: Top consensus gene sets and boxplot
> ### Aliases: consensusScores
> 
> ### ** Examples
> 
>    # Load some example GSA results:
>    data(gsa_results)
>       
>    # Consensus scores for the top 50 gene sets (in the non-directional class):
>    cs <- consensusScores(resList=gsa_results,class="non")
>    
>    # Access the ranks given to gene set s7 by each individual method:
>    cs$rankMat["s7",]
    ConsRank    ConsScore         mean       median       fisher     reporter 
           1            1           20            1            1            1 
    stouffer tailStrength 
          21            1 
> 
> 
> 
> 
> 
> 
> dev.off()
null device 
          1 
>