Supported by Dr. Osamu Ogasawara and  . . |
|
Last data update: 2014.03.03 |
Yi Lin's simulations for microarray analysisDescriptionExample simulations See Alsomultipickgene Examples
### Note: This uses old pickgene
#detail of the model (7-8). (first run does not include meas error eta_i)
#par(mfrow=c(3,3))
t<-rnorm(10000,4,2)
changes1<-rep(0,10000)
changes1[1:500]<-rnorm(500)
t1<-t+changes1
changes2<-rep(0,10000)
changes2[1:500]<-rnorm(500)
t2<-t+changes2
s<-rnorm(10000,0,0.1)
cx<-3
cy<-2
t1<-t1+rnorm(10000,0,0.1)
t2<-t2+rnorm(10000,0,0.1)
x<-cx*exp(t1)
y<-cy*exp(t2)
#x<-cx*exp(t1)+rnorm(10000,0,50)
#y<-cy*exp(t2)+rnorm(10000,0,40)
xx<-qnorm(rank(x)/(10000+1))
yy<-qnorm(rank(y)/(10000+1))
#hist(x,breaks=100)
#hist(y,breaks=100)
#plot(x,y)
#hist(y[x<=0],breaks=20)
#hist(x[y<=0],breaks=20)
#plot(xx,yy)
topgenepick<-multipickgene( cbind(xx,yy),condi=0:1,geneID=1:10000, d=1,
npickgene=500)$pick[[1]]$probe
abchangesrank<-rank((-1)*abs(t1-t2))
count <- rep(NA,500)
for( i in 1:500 ) {
topipick <- topgenepick[1:i]
count[i] <- sum( abchangesrank[topipick] <= i )
}
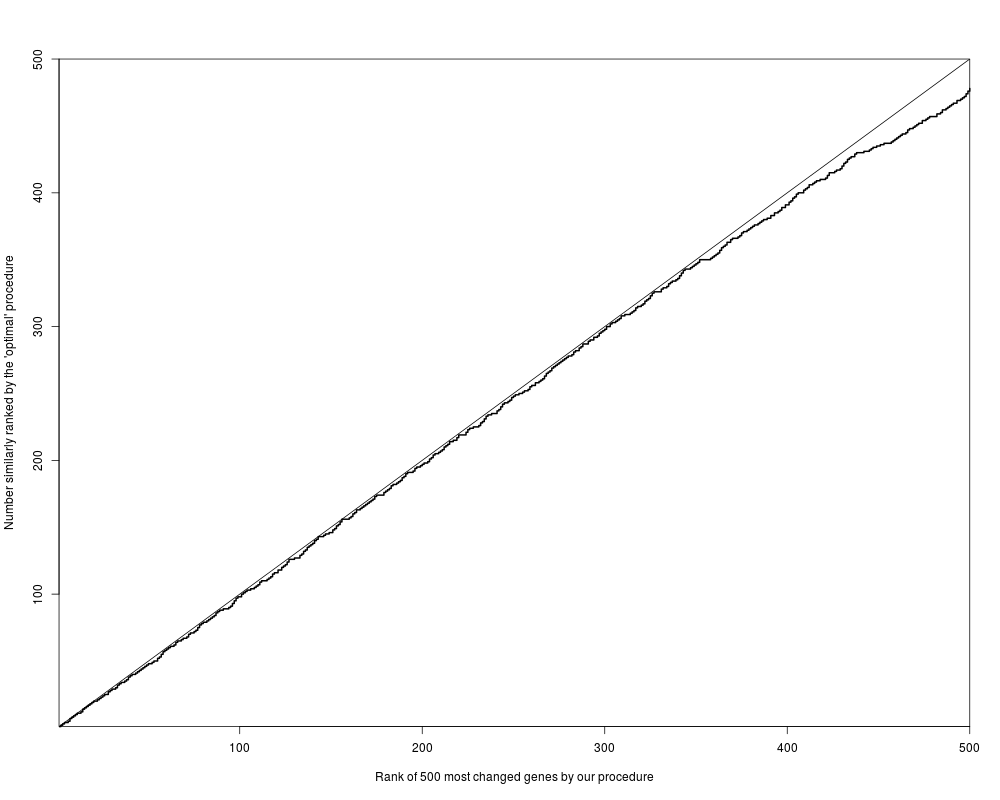
## Figure 2
plot( 1:500, 1:500, type="n",
xlab="Rank of 500 most changed genes by our procedure",
ylab="Number similarly ranked by the 'optimal' procedure",
xaxs="i", yaxs="i" )
lines( 1:500, count, type="s", lty=1, lwd=2 )
abline(0,1)
## Not run: dev.print( hor=F, height=6.5, width=6.5, file="rank1.ps" )
#again, but with the additive noise. (includes eta_i)
par(mfrow=c(2,2))
t<-rnorm(10000,4,2)
changes1<-rep(0,10000)
changes1[1:500]<-rnorm(500)
t1<-t+changes1
changes2<-rep(0,10000)
changes2[1:500]<-rnorm(500)
t2<-t+changes2
s<-rnorm(10000,0,0.1)
cx<-3
cy<-2
t1<-t1+rnorm(10000,0,0.1)
t2<-t2+rnorm(10000,0,0.1)
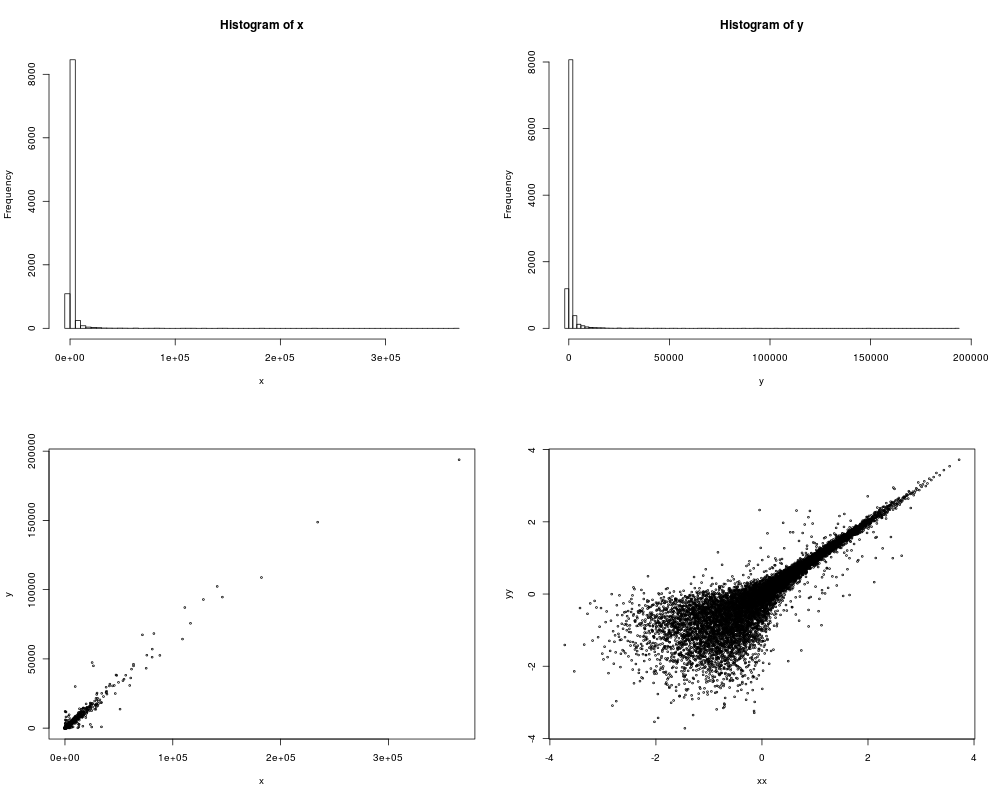
### note that noise is very large here (50,40)
x<-cx*exp(t1)+rnorm(10000,0,50)
y<-cy*exp(t2)+rnorm(10000,0,40)
xx<-qnorm(rank(x)/(10000+1))
yy<-qnorm(rank(y)/(10000+1))
hist(x,breaks=100)
hist(y,breaks=100)
plot(x,y,cex=0.4)
#hist(y[x<=0],breaks=20)
#hist(x[y<=0],breaks=20)
plot(xx,yy,cex=0.4)
## Not run: dev.print( hor=F, height=6.5, width=6.5, file="simudata.ps" )
topgenepick<-multipickgene(cbind(xx,yy),condi=0:1,geneID=1:10000, d=1,
npickgene=500)$pick[[1]]$probe
abchangesrank<-rank((-1)*abs(t1-t2))
count <- rep(NA,500)
for( i in 1:500 ) {
topipick <- topgenepick[1:i]
count[i] <- sum( abchangesrank[topipick] <= i )
}
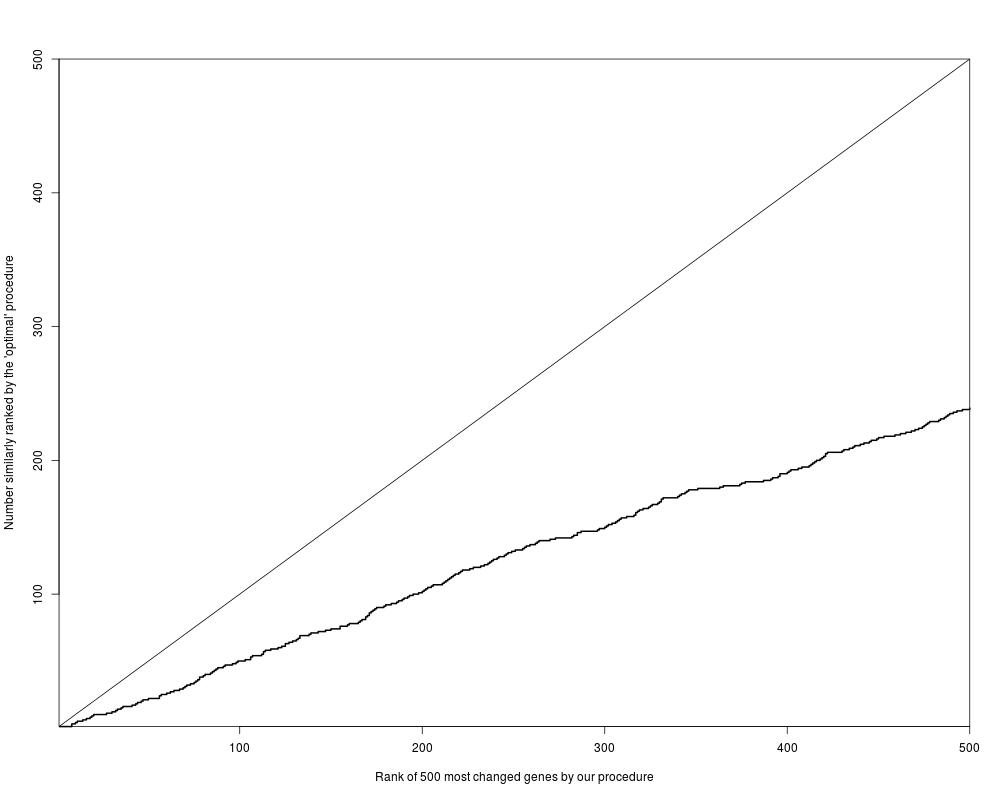
par(mfrow=c(1,1)) # figure 4
plot( 1:500, 1:500, type="n",
xlab="Rank of 500 most changed genes by our procedure",
ylab="Number similarly ranked by the 'optimal' procedure",
xaxs="i", yaxs="i" )
lines( 1:500, count, type="s", lty=1, lwd=2 )
abline(0,1)
## Not run: dev.print( hor=F, height=6.5, width=6.5, file="rank2.ps" )
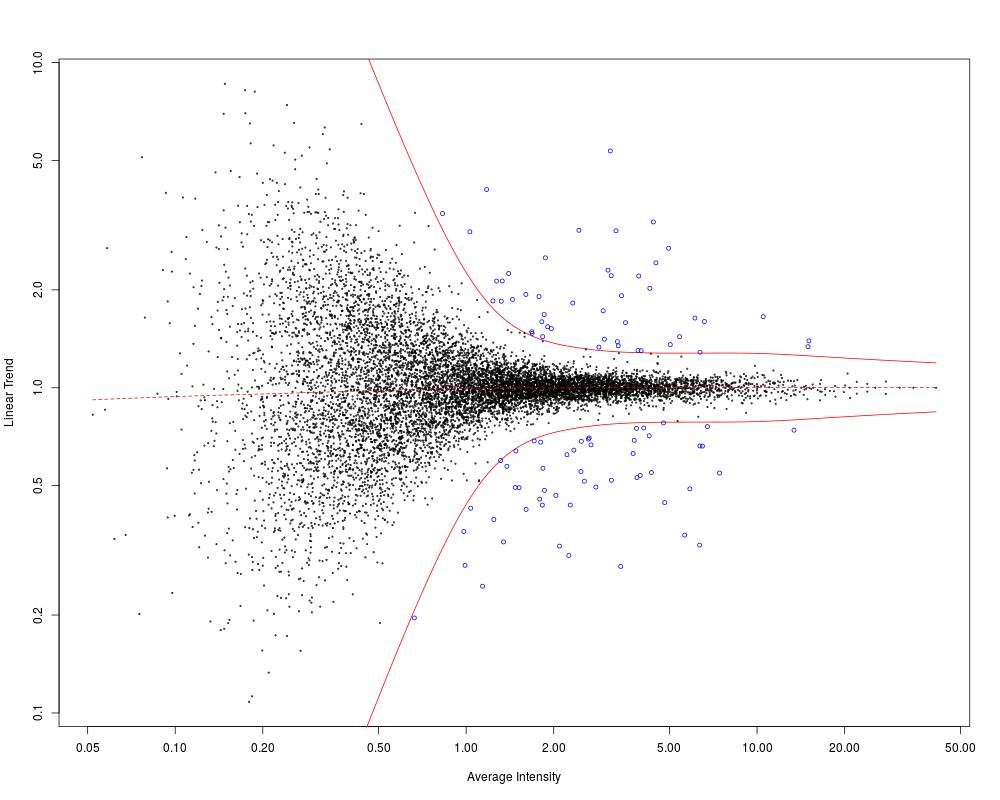
### Figure 5
genepick <- multipickgene( cbind(xx,yy), condi=0:1, geneID=1:10000, d=1)
## Not run: dev.print( hor=F, height=6.5, width=6.5, file="simutest.ps" )$pick[[1]]$probe
npick<-length(genepick$pickedgene)
genepick$pickedgene
npick
count[npick]
Results
R version 3.3.1 (2016-06-21) -- "Bug in Your Hair"
Copyright (C) 2016 The R Foundation for Statistical Computing
Platform: x86_64-pc-linux-gnu (64-bit)

R is free software and comes with ABSOLUTELY NO WARRANTY.
You are welcome to redistribute it under certain conditions.
Type 'license()' or 'licence()' for distribution details.

R is a collaborative project with many contributors.
Type 'contributors()' for more information and
'citation()' on how to cite R or R packages in publications.

Type 'demo()' for some demos, 'help()' for on-line help, or
'help.start()' for an HTML browser interface to help.
Type 'q()' to quit R.

> library(pickgene)

Attaching package: 'pickgene'

The following object is masked from 'package:stats':

    nlminb

> png(filename="/home/ddbj/snapshot/RGM3/R_BC/result/pickgene/Simulation.pickgene.Rd_%03d_medium.png", width=480, height=480)
> ### Name: Simulation.pickgene
> ### Title: Yi Lin's simulations for microarray analysis
> ### Aliases: Simulation.pickgene
>
> ### ** Examples
>
> ### Note: This uses old pickgene
> #detail of the model (7-8). (first run does not include meas error eta_i)
> #par(mfrow=c(3,3))
> t<-rnorm(10000,4,2)
> changes1<-rep(0,10000)
> changes1[1:500]<-rnorm(500)
> t1<-t+changes1
> changes2<-rep(0,10000)
> changes2[1:500]<-rnorm(500)
> t2<-t+changes2
> s<-rnorm(10000,0,0.1)
> cx<-3
> cy<-2
> t1<-t1+rnorm(10000,0,0.1)
> t2<-t2+rnorm(10000,0,0.1)
> x<-cx*exp(t1)
> y<-cy*exp(t2)
> #x<-cx*exp(t1)+rnorm(10000,0,50)
> #y<-cy*exp(t2)+rnorm(10000,0,40)
> xx<-qnorm(rank(x)/(10000+1))
> yy<-qnorm(rank(y)/(10000+1))
> #hist(x,breaks=100)
> #hist(y,breaks=100)
> #plot(x,y)
> #hist(y[x<=0],breaks=20)
> #hist(x[y<=0],breaks=20)
> #plot(xx,yy)
> topgenepick<-multipickgene( cbind(xx,yy),condi=0:1,geneID=1:10000, d=1,
+                            npickgene=500)$pick[[1]]$probe
> abchangesrank<-rank((-1)*abs(t1-t2))
> count <- rep(NA,500)
> for( i in 1:500 ) {
+ topipick <- topgenepick[1:i]
+ count[i] <- sum( abchangesrank[topipick] <= i )
+ }
>
> ## Figure 2
> plot( 1:500, 1:500, type="n",
+      xlab="Rank of 500 most changed genes by our procedure",
+      ylab="Number similarly ranked by the 'optimal' procedure",
+      xaxs="i", yaxs="i" )
> lines( 1:500, count, type="s", lty=1, lwd=2 )
> abline(0,1)
> ## Not run: dev.print( hor=F, height=6.5, width=6.5, file="rank1.ps" )
>
> #again, but with the additive noise. (includes eta_i)
> par(mfrow=c(2,2))
> t<-rnorm(10000,4,2)
> changes1<-rep(0,10000)
> changes1[1:500]<-rnorm(500)
> t1<-t+changes1
> changes2<-rep(0,10000)
> changes2[1:500]<-rnorm(500)
> t2<-t+changes2
> s<-rnorm(10000,0,0.1)
> cx<-3
> cy<-2
> t1<-t1+rnorm(10000,0,0.1)
> t2<-t2+rnorm(10000,0,0.1)
> ### note that noise is very large here (50,40)
> x<-cx*exp(t1)+rnorm(10000,0,50)
> y<-cy*exp(t2)+rnorm(10000,0,40)
> xx<-qnorm(rank(x)/(10000+1))
> yy<-qnorm(rank(y)/(10000+1))
> hist(x,breaks=100)
> hist(y,breaks=100)
> plot(x,y,cex=0.4)
> #hist(y[x<=0],breaks=20)
> #hist(x[y<=0],breaks=20)
> plot(xx,yy,cex=0.4)
> ## Not run: dev.print( hor=F, height=6.5, width=6.5, file="simudata.ps" )
>
> topgenepick<-multipickgene(cbind(xx,yy),condi=0:1,geneID=1:10000, d=1,
+                            npickgene=500)$pick[[1]]$probe
> abchangesrank<-rank((-1)*abs(t1-t2))
> count <- rep(NA,500)
> for( i in 1:500 ) {
+ topipick <- topgenepick[1:i]
+ count[i] <- sum( abchangesrank[topipick] <= i )
+ }
> par(mfrow=c(1,1)) # figure 4
> plot( 1:500, 1:500, type="n",
+      xlab="Rank of 500 most changed genes by our procedure",
+      ylab="Number similarly ranked by the 'optimal' procedure",
+      xaxs="i", yaxs="i" )
> lines( 1:500, count, type="s", lty=1, lwd=2 )
> abline(0,1)
> ## Not run: dev.print( hor=F, height=6.5, width=6.5, file="rank2.ps" )
>
> ### Figure 5
> genepick <- multipickgene( cbind(xx,yy), condi=0:1, geneID=1:10000, d=1)
> ## Not run: dev.print( hor=F, height=6.5, width=6.5, file="simutest.ps" )$pick[[1]]$probe
> npick<-length(genepick$pickedgene)
> genepick$pickedgene
NULL
> npick
[1] 0
> count[npick]
integer(0)
>
>
>
>
>
> dev.off()
null device
          1
>
|
Created & Maintained by Osamu Ogasawara (osamu.ogasawara@gmail.com) and 