Supported by Dr. Osamu Ogasawara and  . . |
|
Last data update: 2014.03.03 |
The model parameters z and WDescriptionContribution of each sample to a dependency model, and contribution of each variable. Usagez.effects(model, X, Y = NULL) W.effects(model, X, Y = NULL) Arguments
Details
Original data can be retrieved by locating the row in Value
Author(s)Olli-Pekka Huovilainen ohuovila@gmail.com and Leo Lahti leo.lahti@iki.fi ReferencesDependency Detection with Similarity Constraints, Lahti et al., 2009 Proc. MLSP'09 IEEE International Workshop on Machine Learning for Signal Processing, See http://www.cis.hut.fi/lmlahti/publications/mlsp09_preprint.pdf A Probabilistic Interpretation of Canonical Correlation Analysis, Bach Francis R. and Jordan Michael I. 2005 Technical Report 688. Department of Statistics, University of California, Berkley. http://www.di.ens.fr/~fbach/probacca.pdf Probabilistic Principal Component Analysis, Tipping Michael E. and Bishop Christopher M. 1999. Journal of the Royal Statistical Society, Series B, 61, Part 3, pp. 611–622. http://research.microsoft.com/en-us/um/people/cmbishop/downloads/Bishop-PPCA-JRSS.pdf See Also
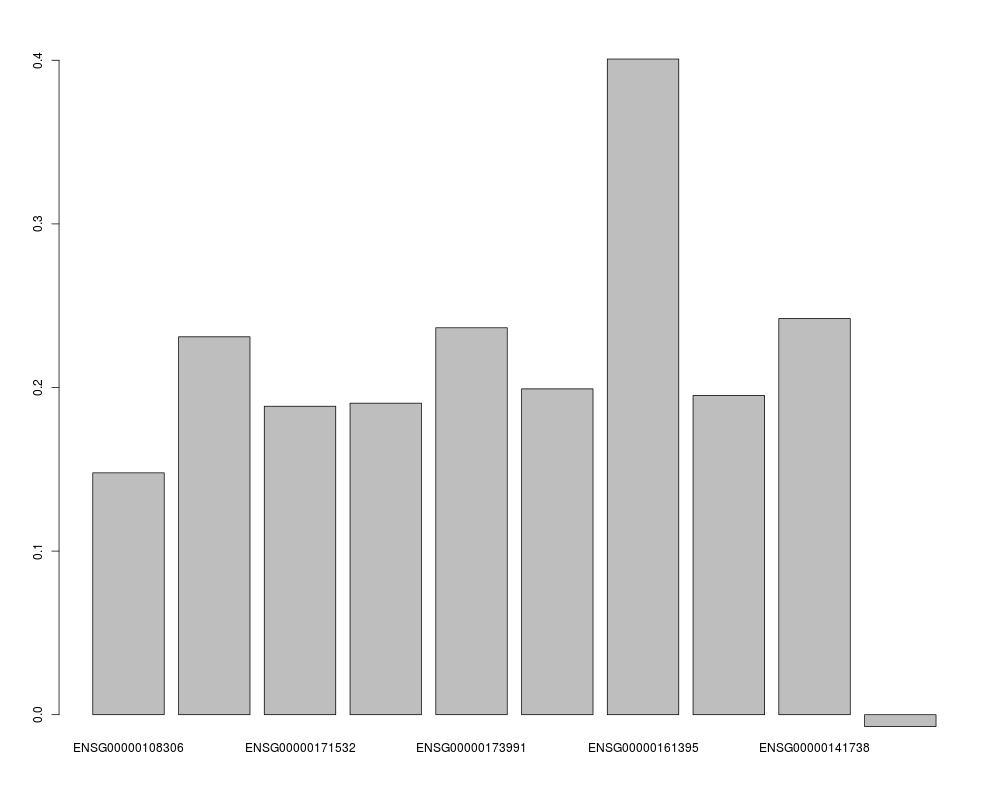
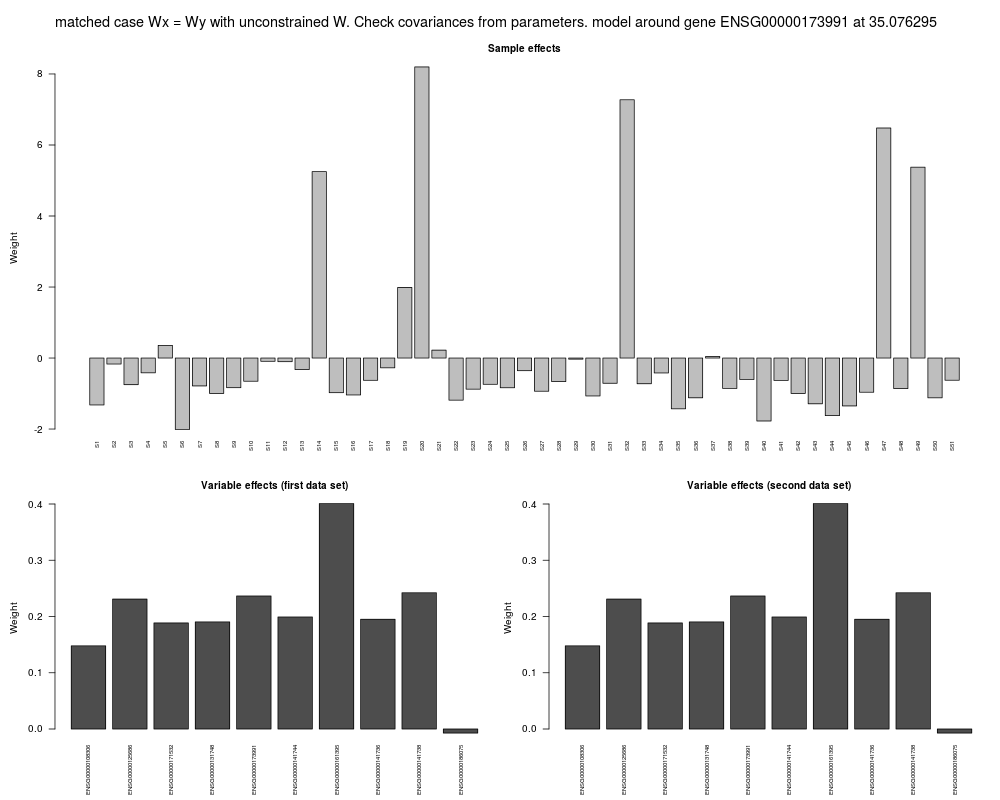
Examplesdata(chromosome17) window <- fixed.window(geneExp, geneCopyNum, 150, 10) ## pSimCCA model around one gene depmodel <- fit.dependency.model(window$X, window$Y) # Conversion from DependencyModel to GeneDependencyModel so that gene name and location can be stored depmodel <- as(depmodel,"GeneDependencyModel") setGeneName(depmodel) <- window$geneName setLoc(depmodel) <- window$loc barplot(z.effects(depmodel, geneExp, geneCopyNum)) ## Plot the contribution of each genes to the model. Only the X component is plotted ## here since Wx = Wy (in SimCCA) barplot(W.effects(depmodel, geneExp, geneCopyNum)$X) ## plot.DpenendencyModel shows also sample and variable effects plot(depmodel,geneExp,geneCopyNum) Results
R version 3.3.1 (2016-06-21) -- "Bug in Your Hair"
Copyright (C) 2016 The R Foundation for Statistical Computing
Platform: x86_64-pc-linux-gnu (64-bit)

R is free software and comes with ABSOLUTELY NO WARRANTY.
You are welcome to redistribute it under certain conditions.
Type 'license()' or 'licence()' for distribution details.

R is a collaborative project with many contributors.
Type 'contributors()' for more information and
'citation()' on how to cite R or R packages in publications.

Type 'demo()' for some demos, 'help()' for on-line help, or
'help.start()' for an HTML browser interface to help.
Type 'q()' to quit R.

> library(pint)
Loading required package: mvtnorm
Loading required package: Matrix
Loading required package: dmt
Loading required package: MASS

dmt Copyright (C) 2008-2013 Leo Lahti and Olli-Pekka Huovilainen.
This program comes with ABSOLUTELY NO
WARRANTY.
This is free software, and you are welcome to redistribute it
under the FreeBSD license.


pint Copyright (C) 2008-2013 Olli-Pekka Huovilainen and Leo Lahti.

This program comes with ABSOLUTELY NO WARRANTY.
This is free software, and you are welcome to redistribute it
under the FreeBSD license.

> png(filename="/home/ddbj/snapshot/RGM3/R_BC/result/pint/z.effect.Rd_%03d_medium.png", width=480, height=480)
> ### Name: z.effects
> ### Title: The model parameters z and W
> ### Aliases: z.effects W.effects
> ### Keywords: math
>
> ### ** Examples
>
> data(chromosome17)
> window <- fixed.window(geneExp, geneCopyNum, 150, 10)
>
> ## pSimCCA model around one gene
> depmodel <- fit.dependency.model(window$X, window$Y)
Matched variables but priors$Nm.wxwy.sigma not given, using strong matching with Wx = Wy.
The matrix Nm.wxwy.mean is not specified. Using identity matrix.
> # Conversion from DependencyModel to GeneDependencyModel so that gene name and location can be stored
> depmodel <- as(depmodel,"GeneDependencyModel")
> setGeneName(depmodel) <- window$geneName
> setLoc(depmodel) <- window$loc
> barplot(z.effects(depmodel, geneExp, geneCopyNum))
>
> ## Plot the contribution of each genes to the model. Only the X component is plotted
> ## here since Wx = Wy (in SimCCA)
> barplot(W.effects(depmodel, geneExp, geneCopyNum)$X)
>
> ## plot.DpenendencyModel shows also sample and variable effects
> plot(depmodel,geneExp,geneCopyNum)
>
>
>
>
>
> dev.off()
null device
          1
>
|