Supported by Dr. Osamu Ogasawara and  . . |
|
Last data update: 2014.03.03 |
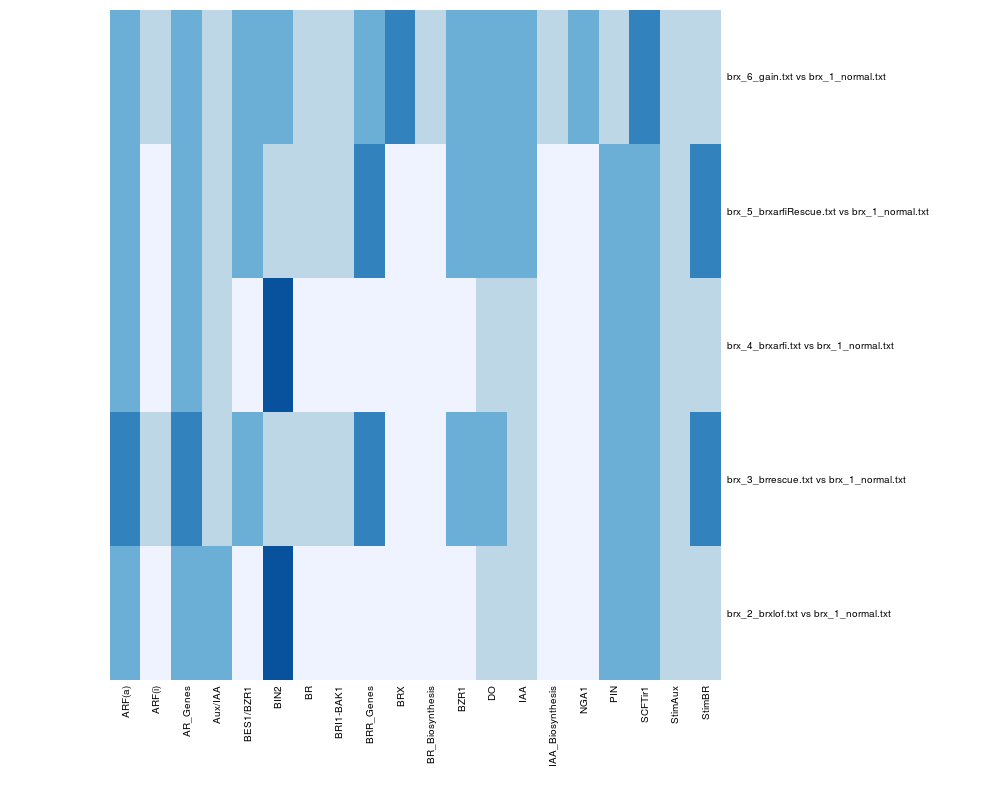
Prediction mapDescriptionThis method is used to visualize the prediction heat-map. The prediction map is generated by mapping a color code on the ratio of the fitted values. UsageplotPredMap(object) Arguments
DetailsThis method firstly interpolate the SQUAD Simulation Result. Then, it performs a ratio at a user-defined time point. Finally, a color code is assigned to the ratio value. The darker the color, the higher the increase of the node activation. Author(s)Martial Sankar See AlsoMore information about heatmap, Examples
fpath <- system.file("extdata", package="SQUADD")
fileModel <- file.path(fpath,"data_IAA")
nm <- c("ARF(a)", "ARF(i)", "AR_Genes", "Aux/IAA", "BES1/BZR1",
 "BIN2", "BR", "BRI1-BAK1","BRR_Genes","BRX","BR_Biosynthesis",  "BZR1", "DO",
  "IAA", "IAA_Biosynthesis",   "NGA1", "PIN", "SCFTir1","StimAux", "StimBR")
t <- 50

## call constructor
obj <- simResService(
		folder=fileModel,
		time=t,
		ncolor=5,
		legend=nm,
		indexDeno=1,
		method="lowess")

## Apply method
plotPredMap(obj)
Results
R version 3.3.1 (2016-06-21) -- "Bug in Your Hair"
Copyright (C) 2016 The R Foundation for Statistical Computing
Platform: x86_64-pc-linux-gnu (64-bit)

R is free software and comes with ABSOLUTELY NO WARRANTY.
You are welcome to redistribute it under certain conditions.
Type 'license()' or 'licence()' for distribution details.

R is a collaborative project with many contributors.
Type 'contributors()' for more information and
'citation()' on how to cite R or R packages in publications.

Type 'demo()' for some demos, 'help()' for on-line help, or
'help.start()' for an HTML browser interface to help.
Type 'q()' to quit R.

> library(SQUADD)
> png(filename="/home/ddbj/snapshot/RGM3/R_BC/result/SQUADD/plotPredMap.Rd_%03d_medium.png", width=480, height=480)
> ### Name: plotPredMap
> ### Title: Prediction map
> ### Aliases: plotPredMap
> ### Keywords: prediction heatmap
>
> ### ** Examples
>
> fpath <- system.file("extdata", package="SQUADD")
> fileModel <- file.path(fpath,"data_IAA")
> nm <- c("ARF(a)", "ARF(i)", "AR_Genes", "Aux/IAA", "BES1/BZR1",
+  "BIN2", "BR", "BRI1-BAK1","BRR_Genes","BRX","BR_Biosynthesis",  "BZR1", "DO",
+   "IAA", "IAA_Biosynthesis",   "NGA1", "PIN", "SCFTir1","StimAux", "StimBR")
> t <- 50
>
> ## call constructor
> obj <- simResService(
+ 		folder=fileModel,
+ 		time=t,
+ 		ncolor=5,
+ 		legend=nm,
+ 		indexDeno=1,
+ 		method="lowess")
>
> ## Apply method
> plotPredMap(obj)
>
>
>
>
>
>
> dev.off()
null device
          1
>
|
Created & Maintained by Osamu Ogasawara (osamu.ogasawara@gmail.com) and 