The stochastic data generators generate stochastic noise with (if specified correctly) the same properties as the observed data. By replicating the stochastic properties of the original data, we are able to obtain the exact calculation of p values.
Usage
a3.gen.default(x, n.reps)
Arguments
x
the original (observed) data series.
n.reps
the number of stochastic repetitions to generate.
Details
Generally these will not be called directly but will instead be passed to the data.generating.fn argument of a3.base.
Value
A list of of length n.reps of vectors of stochastic noise. There are a number of different methods of generating noise:
a3.gen.default
The default data generator. Uses a3.gen.bootstrap.
a3.gen.resample
Reorders the original data series.
a3.gen.bootstrap
Resamples the original data series with replacement.
a3.gen.normal
Calculates the mean and standard deviation of the original series and generates a new series with that distribution.
a3.gen.autocor
Assumesa first order autocorrelation of the original series and generates a new series with the same properties.
Examples
# Calculate the A3 results assuming an auto-correlated set of observations.
# In usage p.acc should be <=0.01 in order to obtain more accurate p values.
a3.lm(rating ~ ., attitude, p.acc = 0.1,
data.generating.fn = replicate(ncol(attitude), a3.gen.autocor))
## A general illustration:
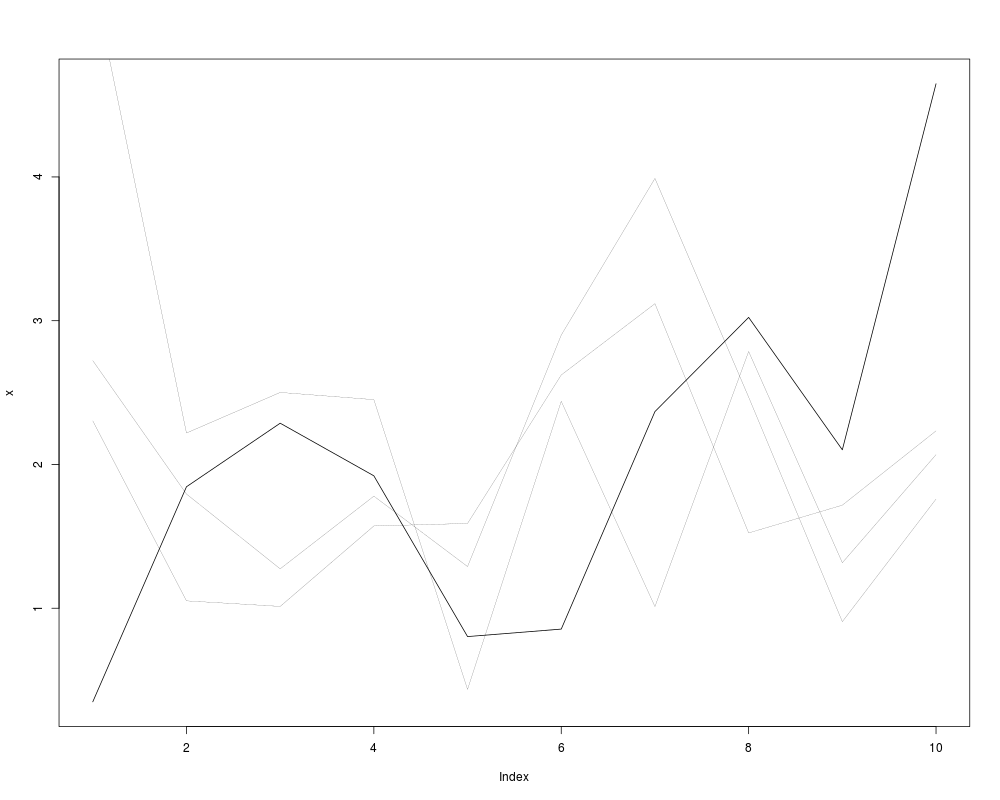
# Take x as a sample set of observations for a feature
x <- c(0.349, 1.845, 2.287, 1.921, 0.803, 0.855, 2.368, 3.023, 2.102, 4.648)
# Generate three stochastic data series with the same autocorrelation properties as x
rand.x <- a3.gen.autocor(x, 3)
plot(x, type="l")
for(i in 1:3) lines(rand.x[[i]], lwd = 0.2)
Results
R version 3.3.1 (2016-06-21) -- "Bug in Your Hair"
Copyright (C) 2016 The R Foundation for Statistical Computing
Platform: x86_64-pc-linux-gnu (64-bit)

R is free software and comes with ABSOLUTELY NO WARRANTY.
You are welcome to redistribute it under certain conditions.
Type 'license()' or 'licence()' for distribution details.

R is a collaborative project with many contributors.
Type 'contributors()' for more information and
'citation()' on how to cite R or R packages in publications.

Type 'demo()' for some demos, 'help()' for on-line help, or
'help.start()' for an HTML browser interface to help.
Type 'q()' to quit R.

> library(A3)
Loading required package: xtable
Loading required package: pbapply
> png(filename="/home/ddbj/snapshot/RGM3/R_CC/result/A3/a3.gen.default.Rd_%03d_medium.png", width=480, height=480)
> ### Name: a3.gen.default
> ### Title: Stochastic Data Generators
> ### Aliases: a3.gen.autocor a3.gen.bootstrap a3.gen.default a3.gen.normal
> ###   a3.gen.resample
>
> ### ** Examples
>
> ## No test:
>  # Calculate the A3 results assuming an auto-correlated set of observations.
>  # In usage p.acc should be <=0.01 in order to obtain more accurate p values.
>
>  a3.lm(rating ~ ., attitude, p.acc = 0.1,
+    data.generating.fn = replicate(ncol(attitude), a3.gen.autocor))
             Average Slope   CV R^2 p value
-Full Model-                 59.5 %   < 0.1
(Intercept)        10.7871 -  0.8 %     0.5
complaints          0.6132 + 19.7 %   < 0.1
privileges         -0.0731 -  2.3 %     0.3
learning            0.3203 +  4.9 %   < 0.1
raises              0.0817 -  0.7 %     0.2
critical            0.0384 -  2.7 %     0.6
advance            -0.2171 +  1.1 %     0.2
>
> ## End(No test)
>
>  ## A general illustration:
>
>  # Take x as a sample set of observations for a feature
>  x <- c(0.349, 1.845, 2.287, 1.921, 0.803, 0.855, 2.368, 3.023, 2.102, 4.648)
>
>  # Generate three stochastic data series with the same autocorrelation properties as x
>  rand.x <- a3.gen.autocor(x, 3)
>
>  plot(x, type="l")
>  for(i in 1:3) lines(rand.x[[i]], lwd = 0.2)
>
>
>
>
>
> dev.off()
null device
          1
>
 .
.