R version 3.3.1 (2016-06-21) -- "Bug in Your Hair"
Copyright (C) 2016 The R Foundation for Statistical Computing
Platform: x86_64-pc-linux-gnu (64-bit)
R is free software and comes with ABSOLUTELY NO WARRANTY.
You are welcome to redistribute it under certain conditions.
Type 'license()' or 'licence()' for distribution details.
R is a collaborative project with many contributors.
Type 'contributors()' for more information and
'citation()' on how to cite R or R packages in publications.
Type 'demo()' for some demos, 'help()' for on-line help, or
'help.start()' for an HTML browser interface to help.
Type 'q()' to quit R.
> library(ACDm)
> png(filename="/home/ddbj/snapshot/RGM3/R_CC/result/ACDm/qqplotAcd.Rd_%03d_medium.png", width=480, height=480)
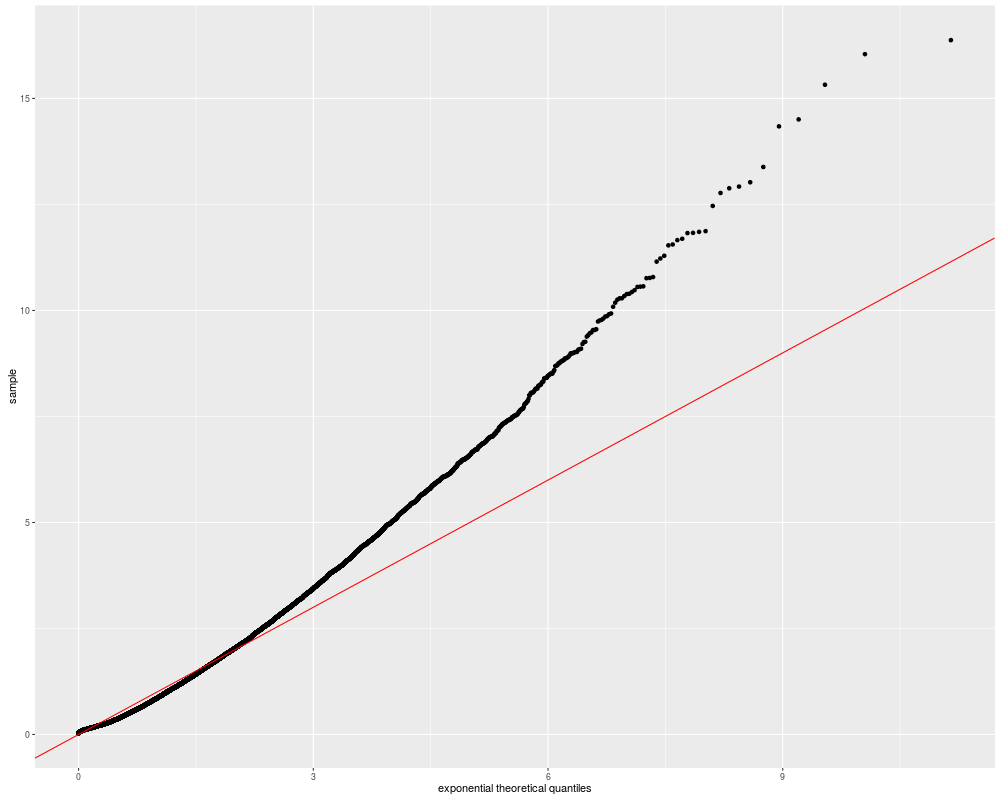
> ### Name: qqplotAcd
> ### Title: Quantile-Quantile plot of the residuals
> ### Aliases: qqplotAcd
>
> ### ** Examples
>
> fitModelExp <- acdFit(adjDurData, dist = "exp")
ACD model estimation by (Quasi) Maximum Likelihood
Call:
acdFit(durations = adjDurData, dist = "exp")
Model:
ACD(1, 1)
Distribution:
exponential
N: 34767
Parameter estimate:
Coef SE PV robustSE
omega 0.0127 0.00132 0 0.00125
alpha1 0.0587 0.00277 0 0.00236
beta1 0.9295 0.00359 0 0.00306
The fixed/unfree mean distribution parameter:
lambda: 1
QML robust correlations:
omega alpha1 beta1
omega 1.000 0.442 -0.762
alpha1 0.442 1.000 -0.902
beta1 -0.762 -0.902 1.000
Goodness of fit:
value
LogLikelihood -33300.775975
AIC 66607.551949
BIC 66632.921221
MSE 1.798696
Convergence: 0
Number of log-likelihood function evaluations: 114
Estimation time: 0.6914 secs
Description: Estimated at 2016-07-04 14:06:30 by user ddbj
> qqplotAcd(fitModelExp)
>
>
>
>
>
> dev.off()
null device
1
>
 .
.